Feb 28, 2026
3 0
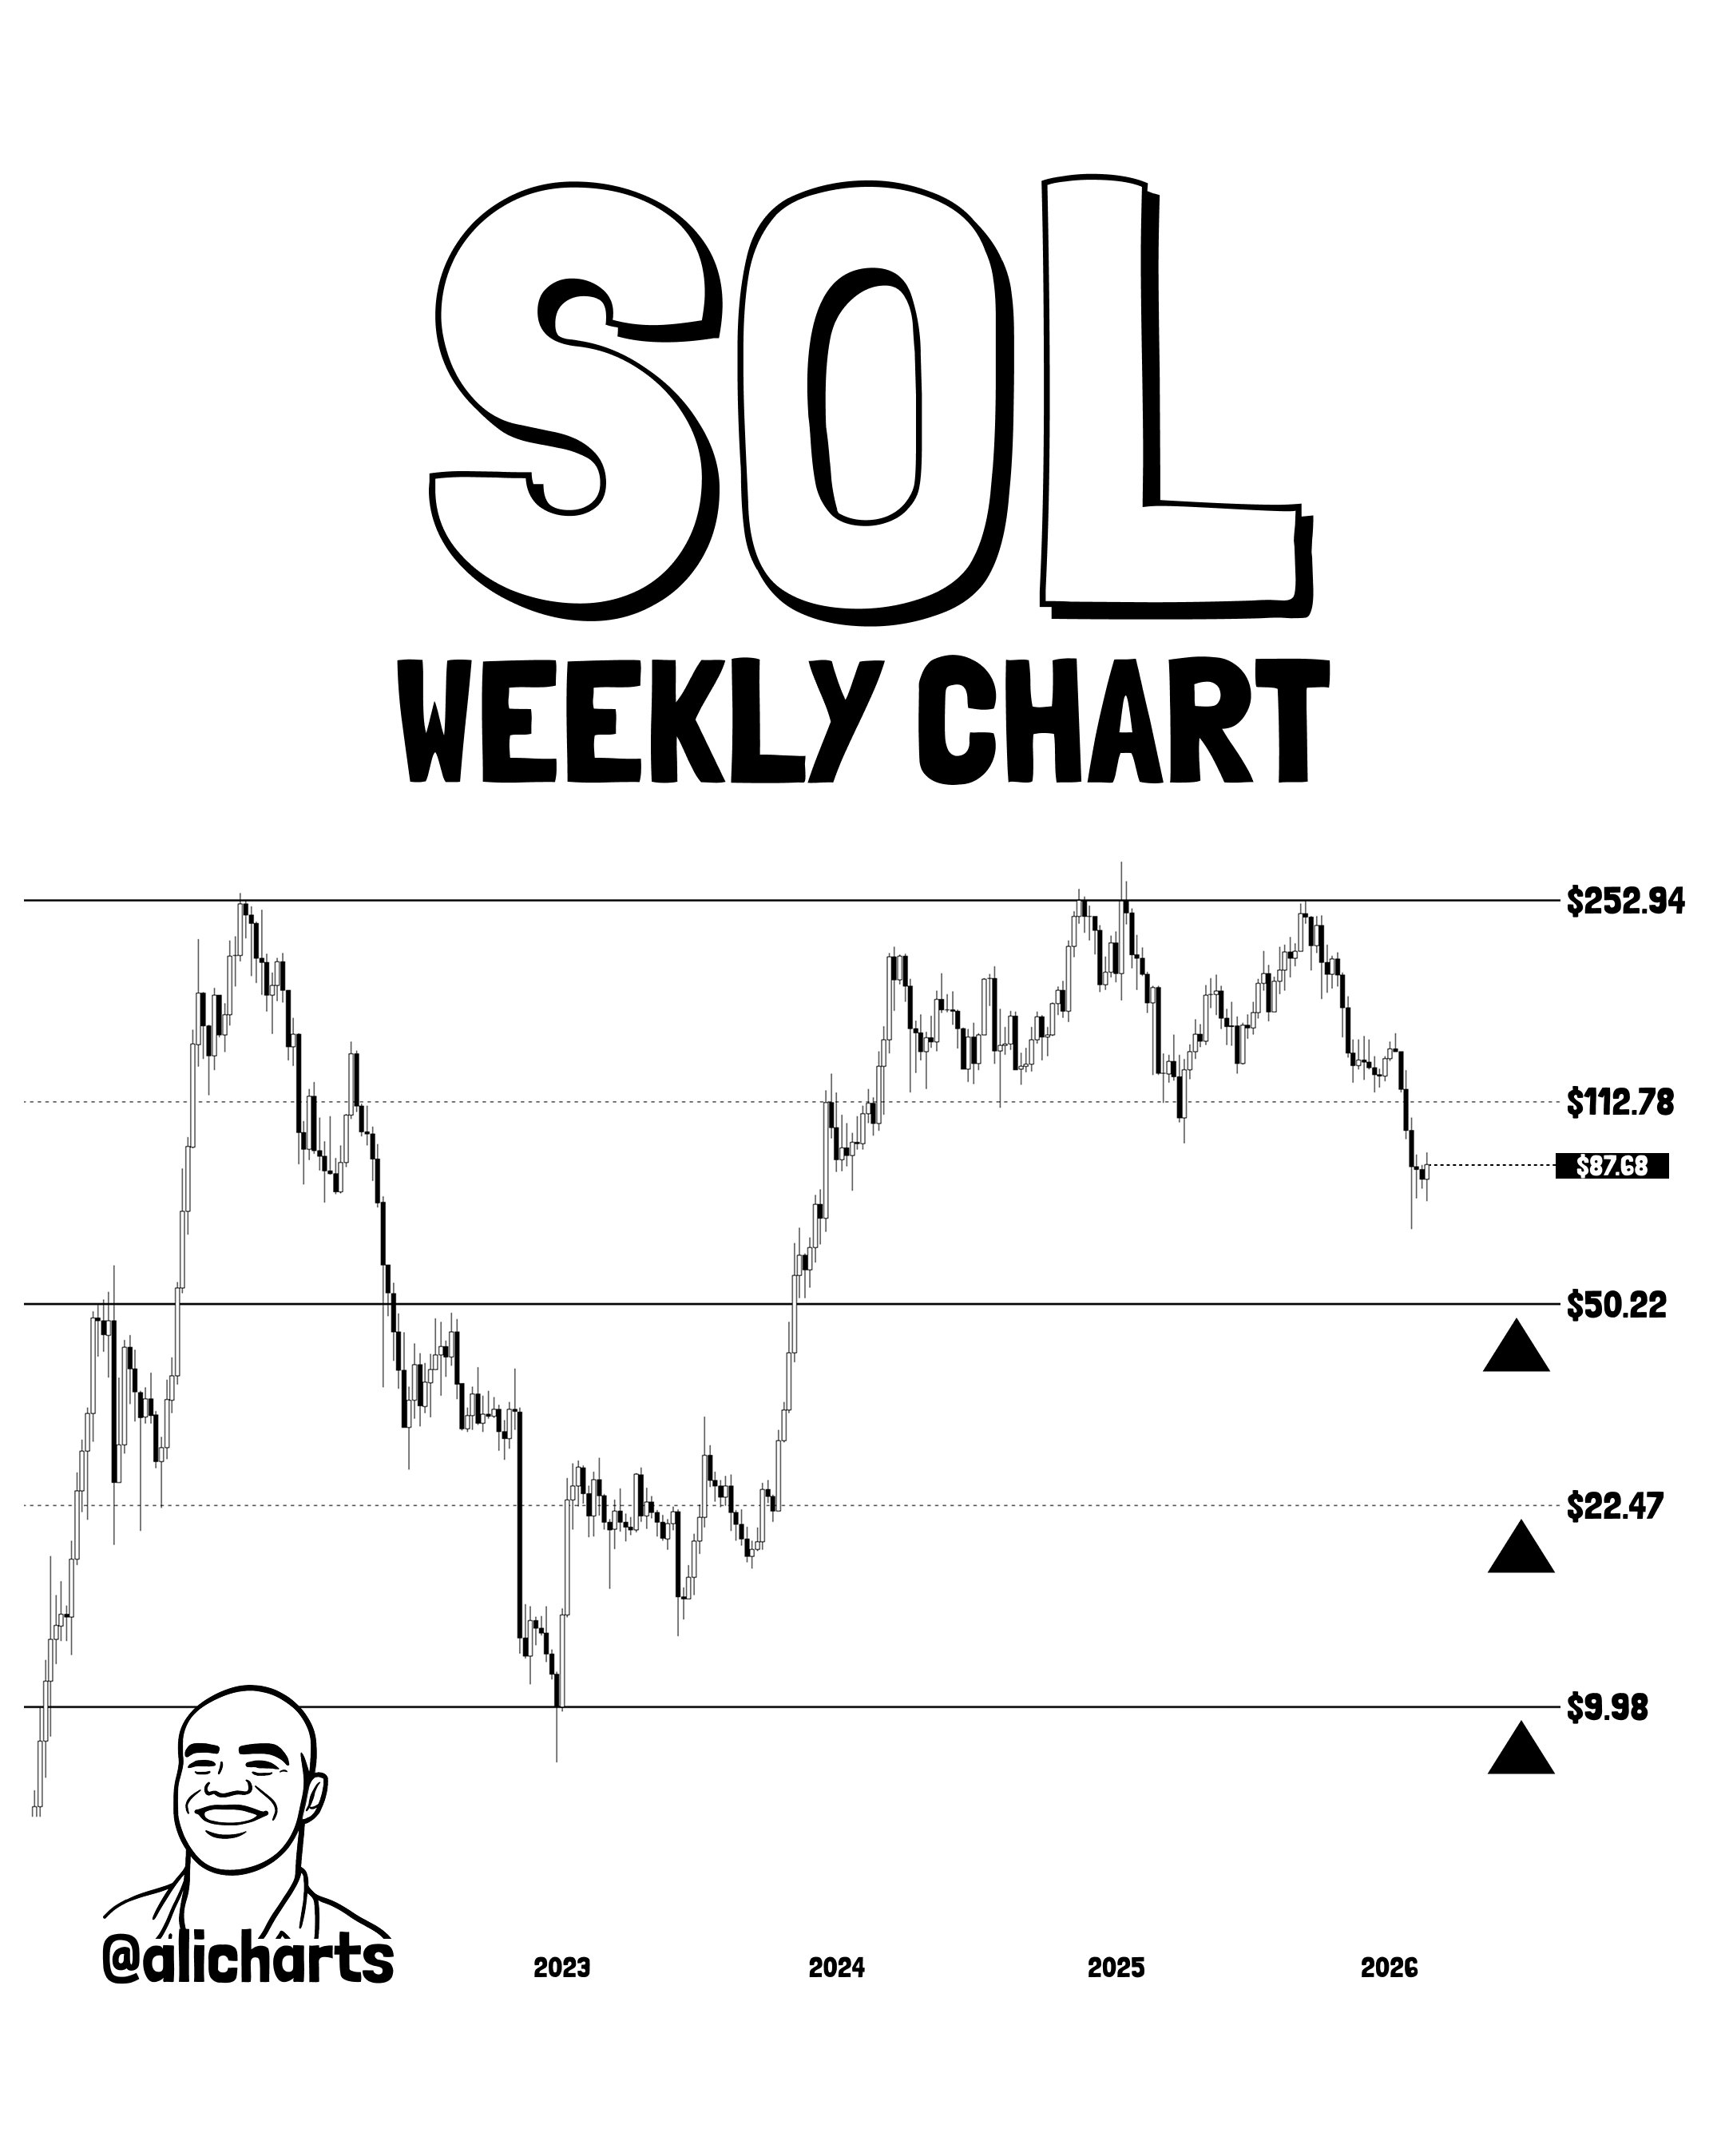
BEARISH 📉 : Solana faces decline as support levels identified at $50, $22, $10
An analysis of Solana's price chart suggests potential support levels due to a Parallel Channel pattern forming. This technical pattern indicates that:
- Solana's price has been moving within this channel, testing the upper level multiple times in 2025, each time resulting in a decline.
- The channel's upper line acts as resistance, and the current bearish market trend has pushed Solana downwards.
- Potential support levels are identified at $50.22, $22.47, and $9.98, corresponding to 50%, 75%, and 100% down the channel, respectively.
- These levels could provide support if the momentum continues to weaken.
Additionally, Stellar (XLM) is also experiencing a similar Parallel Channel setup with possible support points at 0.147, 0.078, and 0.041.

Currently, Solana's price is around $81, having declined by 5.5% in the last 24 hours.