Solana DEX Trading Volume Exceeds $100 Billion for Second Month
Solana, a Layer 1 blockchain network, surpassed a significant milestone for the second consecutive month, attracting attention within the digital asset community. The total decentralized exchange (DEX) trading volume on Solana exceeded $100 billion again, while its native token, #SOL, turned bullish in the past 24 hours.
DEX Trading Volume Comparison
According to DefiLlama data, Solana recorded $100.782 billion in DEX trading volume in December, compared to Ethereum's approximately $77 billion. Other top blockchains included Base with $44.5 billion, BSC with $41.33 billion, and Arbitrum with $30.39 billion, alongside SOL and #ETH.
In October and November, Solana’s DEX trading volumes were $52.49 billion and $129 billion, respectively. Over the past three months, Solana consistently topped the list for highest DEX trading volume, outperforming Ethereum, which had $41.4 billion in October and $70.6 billion in November.
Active Addresses and Total Value Locked
DefiLlama data indicates that Solana had 4.29 million active addresses in the past 24 hours, significantly higher than Ethereum's 475K. However, Ethereum leads in total value locked (TVL) with $68.516 billion, compared to Solana's $8.471 billion.
The increase in DEX trading volume on Solana counters the perception that SOL's popularity stems solely from meme coins created on the platform. According to CoinGecko, the market cap of meme coins on Solana is $16.22 billion, with $3.5 billion traded in the last day.
SOL Price Movement
SOL rebounded from a daily low of $184 to a high of $198.70, currently trading at $197.69 as market dynamics fluctuate. The $200 price level is critical for SOL; rising DEX volume may enable it to reclaim this level.
Over the last week, the SOL token has decreased by 12.11% and by 19.73% in the last 30 days. Additionally, it is trading at a 25.32% discount from its all-time high of $263.83, recorded over a month ago.
-
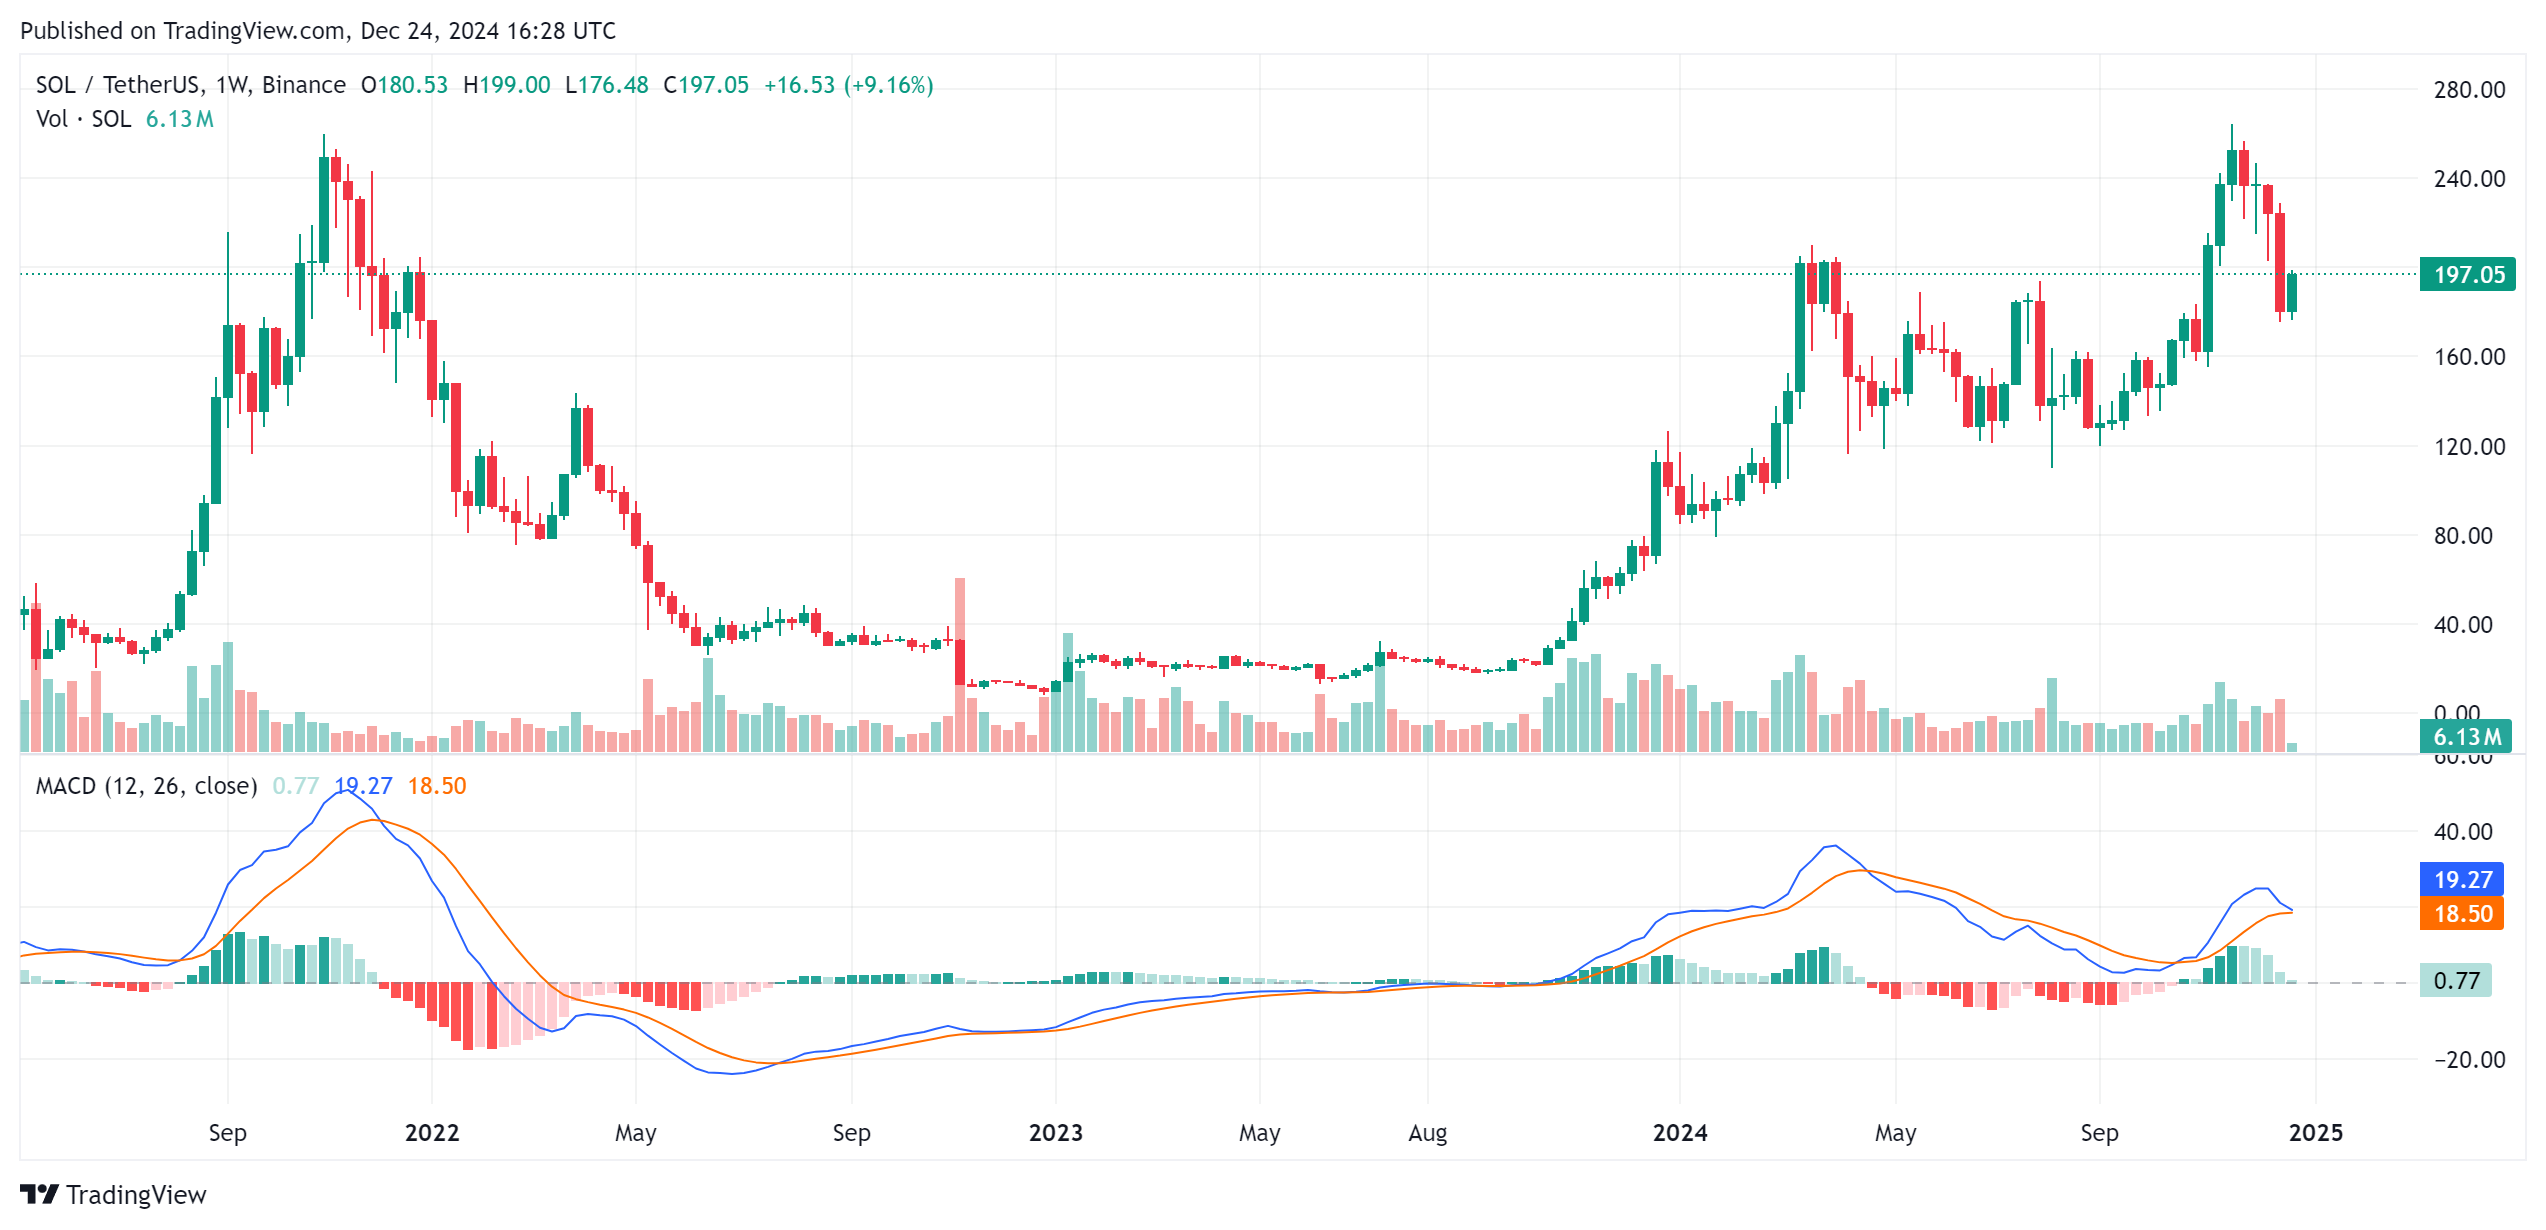
Source: TradingView
- The Solana weekly chart exhibits potential bearish divergence, indicated by the signal line (red) crossing above the MACD line (blue). This suggests a bearish outlook; if SOL fails to reclaim $200 and move toward $210, the MACD histogram could turn red, potentially leading SOL to retest $160 if bearish momentum continues.