Jan 16, 2026
0 0
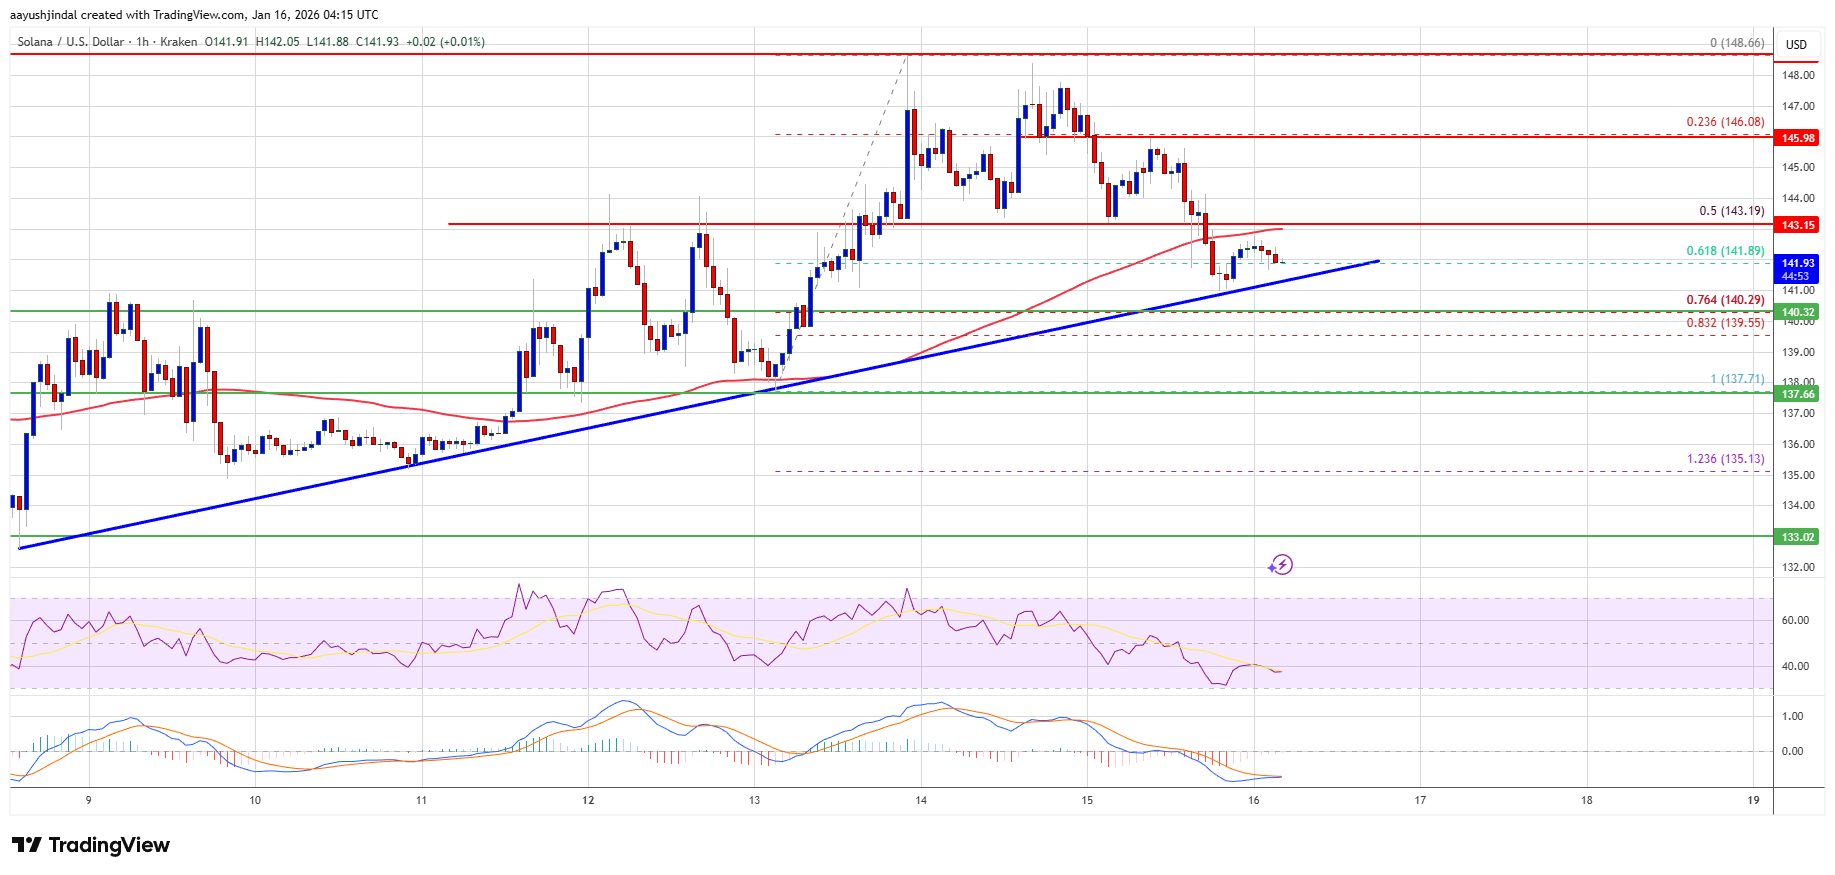
Solana falls below $145, eyes support around $140 zone
Solana Price Analysis
- Solana (SOL) failed to maintain its position above $146, initiating a correction below $145.
- The current trading price is under the 100-hourly simple moving average and faces resistance near $144 and $146.
- A bullish trend line with support at $141 is forming on the hourly chart.
- If SOL breaks below $140, further declines could target the $132 and potentially $124 support levels.
- For upward movement, a close above the $148 resistance could lead to targets at $155 and $162.
Technical Indicators
- Hourly MACD: Indicating increased bearish momentum.
- Hourly RSI: Positioned below 50, suggesting weaker buying strength.
- Major support levels are at $141 and $140; key resistances at $146 and $148.