Dec 30, 2025
10 0
Solana Faces Potential Downtrend Amid Bearish Patterns and Key Resistance
Solana (SOL) is testing a critical resistance area, which may influence its price movement at the beginning of next year.
Recent Price Movements
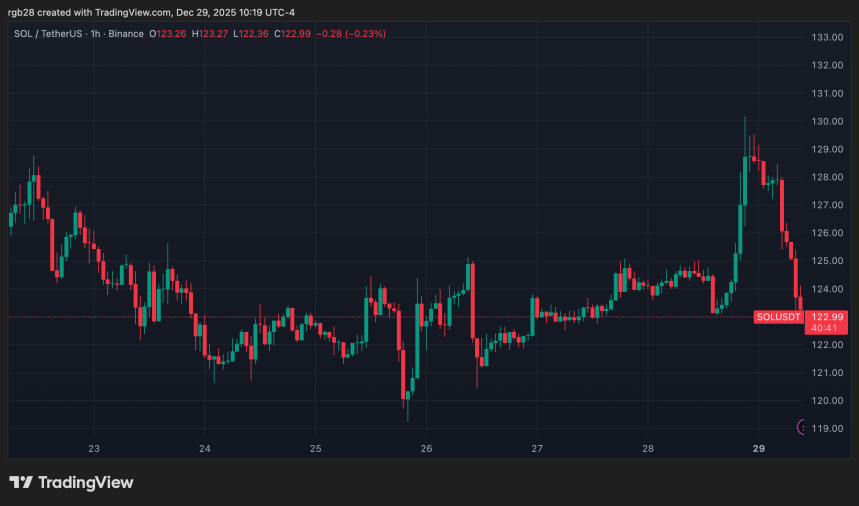
- After reaching $130, Solana corrected to $122, experiencing a 6.1% drop.
- The cryptocurrency has been fluctuating between $120 and $126, facing rejections at local resistance levels.
- A breakout from a six-week falling wedge suggests potential targets at $144-$146 if momentum persists.
Technical Analysis Insights
- An analyst noted that maintaining above the broken trendline is crucial for upward momentum.
- If SOL remains below $146, a potential decline to the $100-105 support area is likely.
- A decisive break below the trendline may confirm further downward movement.
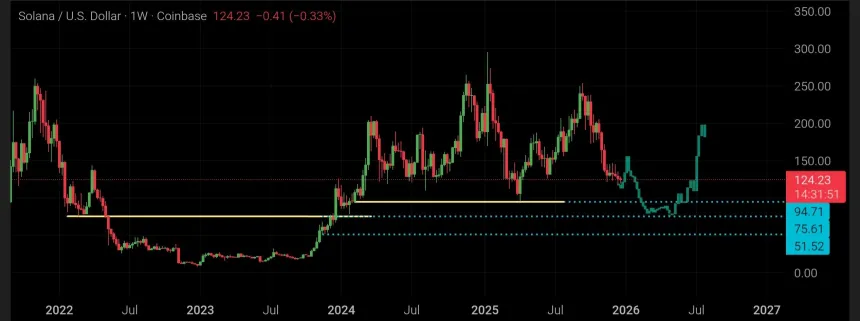
Higher Timeframe Concerns
- Solana's higher timeframe chart indicates a possible multi-year bearish pattern forming.
- A Head and Shoulders pattern with a neckline around $105 could lead to a decline to the $75–$51 range.
- A double top formation suggests a possible retracement toward $60, with risks of dropping to $35.