May 14, 2025
5 0
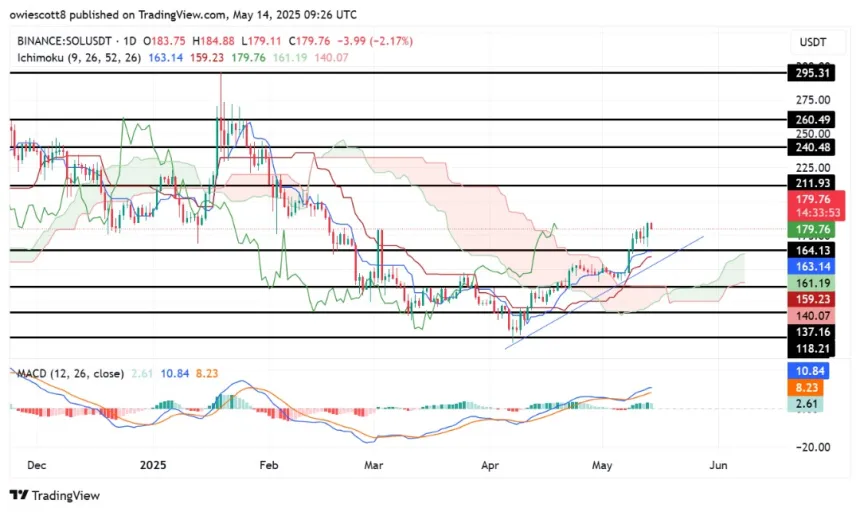
Solana Breaks Above Ichimoku Cloud Indicating Bullish Trend Shift
Solana (SOL) has broken above the Ichimoku Cloud on the daily chart, indicating a potential bullish trend reversal. This breakout follows weeks of sideways movement and suggests a shift in market sentiment toward confidence among buyers.
Key Observations
- Momentum indicators are showing bullish signs, particularly with a positive crossover in the Moving Average Convergence Divergence (MACD).
- The MACD line has crossed above the signal line and both are above the zero line, indicating a transition from bearish to bullish momentum.
- A significant uptick in volume is necessary to sustain this breakout; without it, upward momentum may stall.
Key Price Levels
- Immediate resistance cleared at $164, with a target of $211 for further breakout.
- A sustained breakout above $211 could lead to a rally towards $240 and potentially $260.
- $164 now serves as support; maintaining above this level is crucial for bullish structure.
- A breakdown below $164 could lead SOL back to the $148–$118 support range.