Solana Price Declines Below $175 Support, Approaching $165 Level
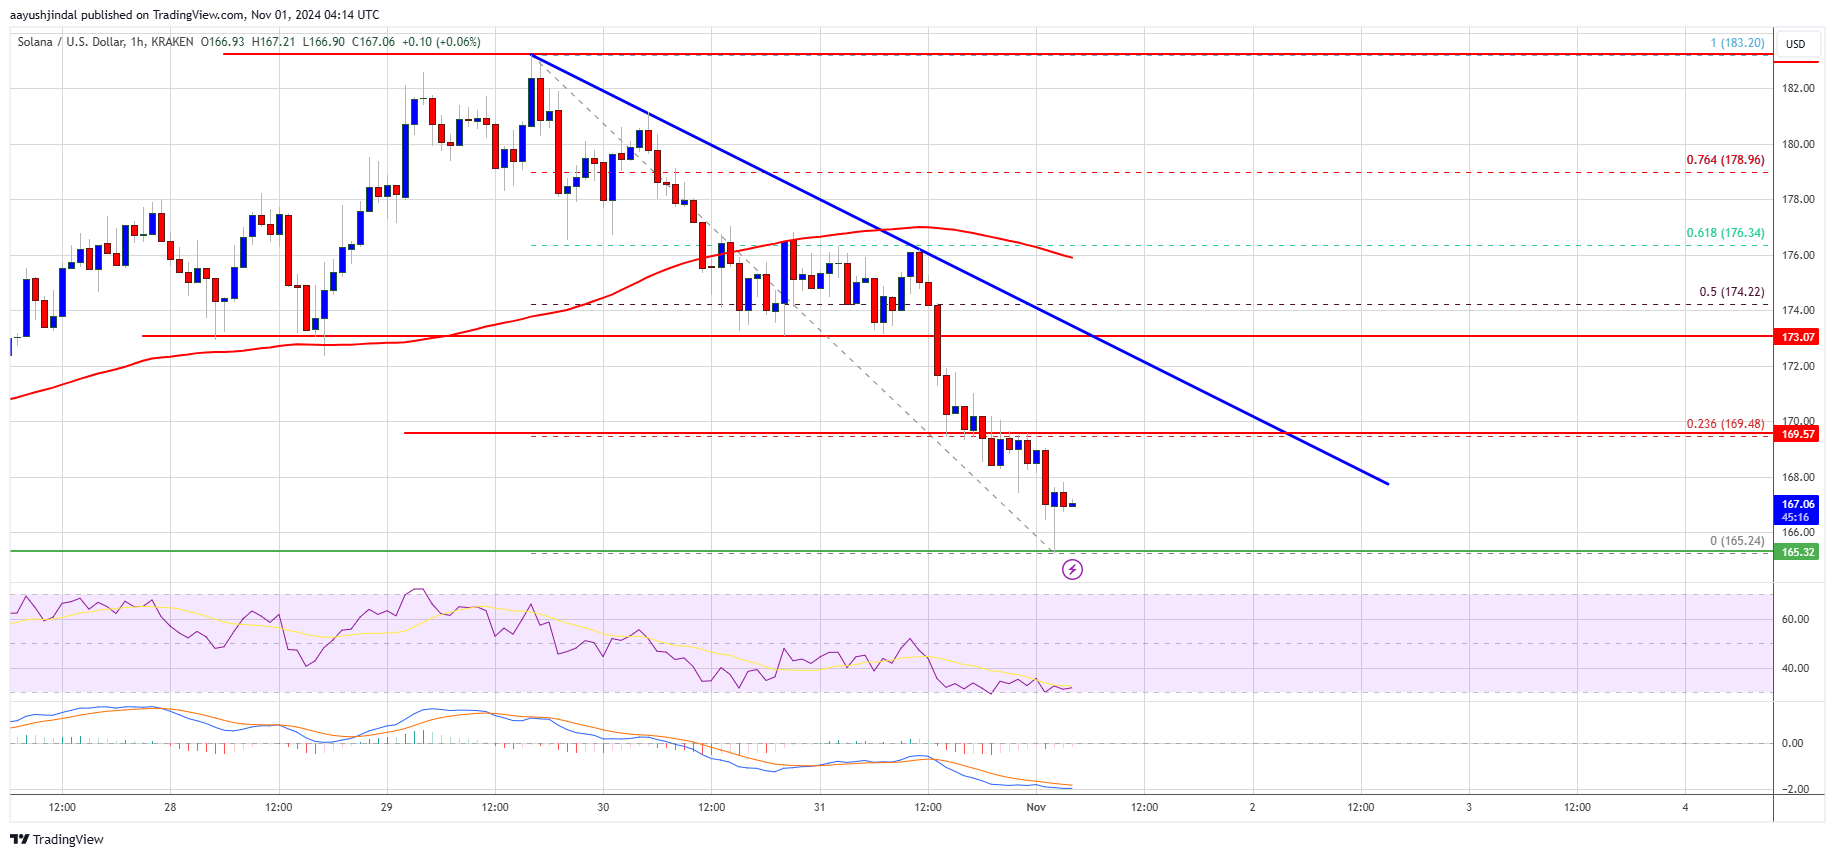
Solana's price has declined, trading below the $175 support zone and approaching the $165 support level, where a potential bounce may occur.
- SOL price experienced a decline after failing to surpass the $185 resistance against the US Dollar.
- The current trading price is below $172 and the 100-hourly simple moving average.
- A bearish trend line is forming with resistance at $172 on the hourly chart of the SOL/USD pair (data source from Kraken).
- The price could recover if it maintains levels above $165 and $162.
Solana Price Holds Support
Solana faced difficulties clearing the $185 resistance, prompting a decline similar to movements in Bitcoin and Ethereum. The price dropped below the $180 and $175 support levels.
Bears pushed the price below $172, testing the $165 support zone. A low was established at $165, and prices are currently consolidating under the 23.6% Fib retracement level from the $183 swing high to the $165 low.
SOL is trading below $172 and the 100-hourly simple moving average, with resistance near the $170 level. The next significant resistance is at $172, coinciding with a key bearish trend line on the hourly chart.
The primary resistance could be at $175 or the 50% Fib retracement level of the drop from the $183 swing high to the $165 low. A successful close above $175 may initiate another upward movement, targeting $182 and potentially reaching $185.
More Losses in SOL?
If SOL does not rise above the $170 resistance, further declines may occur. Initial support is near $165, followed by major support at $162.
A breach below $162 could lead to a decline toward the $150 zone. A close below this level may push the price down to the $135 support in the short term.
Technical Indicators:
- Hourly MACD: Gaining pace in the bearish zone.
- Hourly RSI: Below the 50 level.
- Major Support Levels: $165 and $162.
- Major Resistance Levels: $170 and $172.
