Jan 28, 2026
4 0
BULLISH 📈 : Solana price recovery faces resistance at $128 and $130
Solana (SOL) is experiencing a recovery wave, trading above $125 and the 100-hourly simple moving average. However, it faces resistance around $128.
- SOL price moved above $122 and $125 against the US Dollar.
- A key bearish trend line was broken with resistance at $124 on the hourly SOL/USD chart (source: Kraken).
- Immediate resistance levels are $128 and $130, with major resistance at $135.
Resistance and Support Levels
The price showed stability starting from $118, similar to [Bitcoin](https://holder.io/coins/btc/) and [Ethereum](https://holder.io/coins/eth/), climbing above $122. Resistance is seen at $128, correlating with the 76.4% Fib retracement level of the drop from $132 to $117.
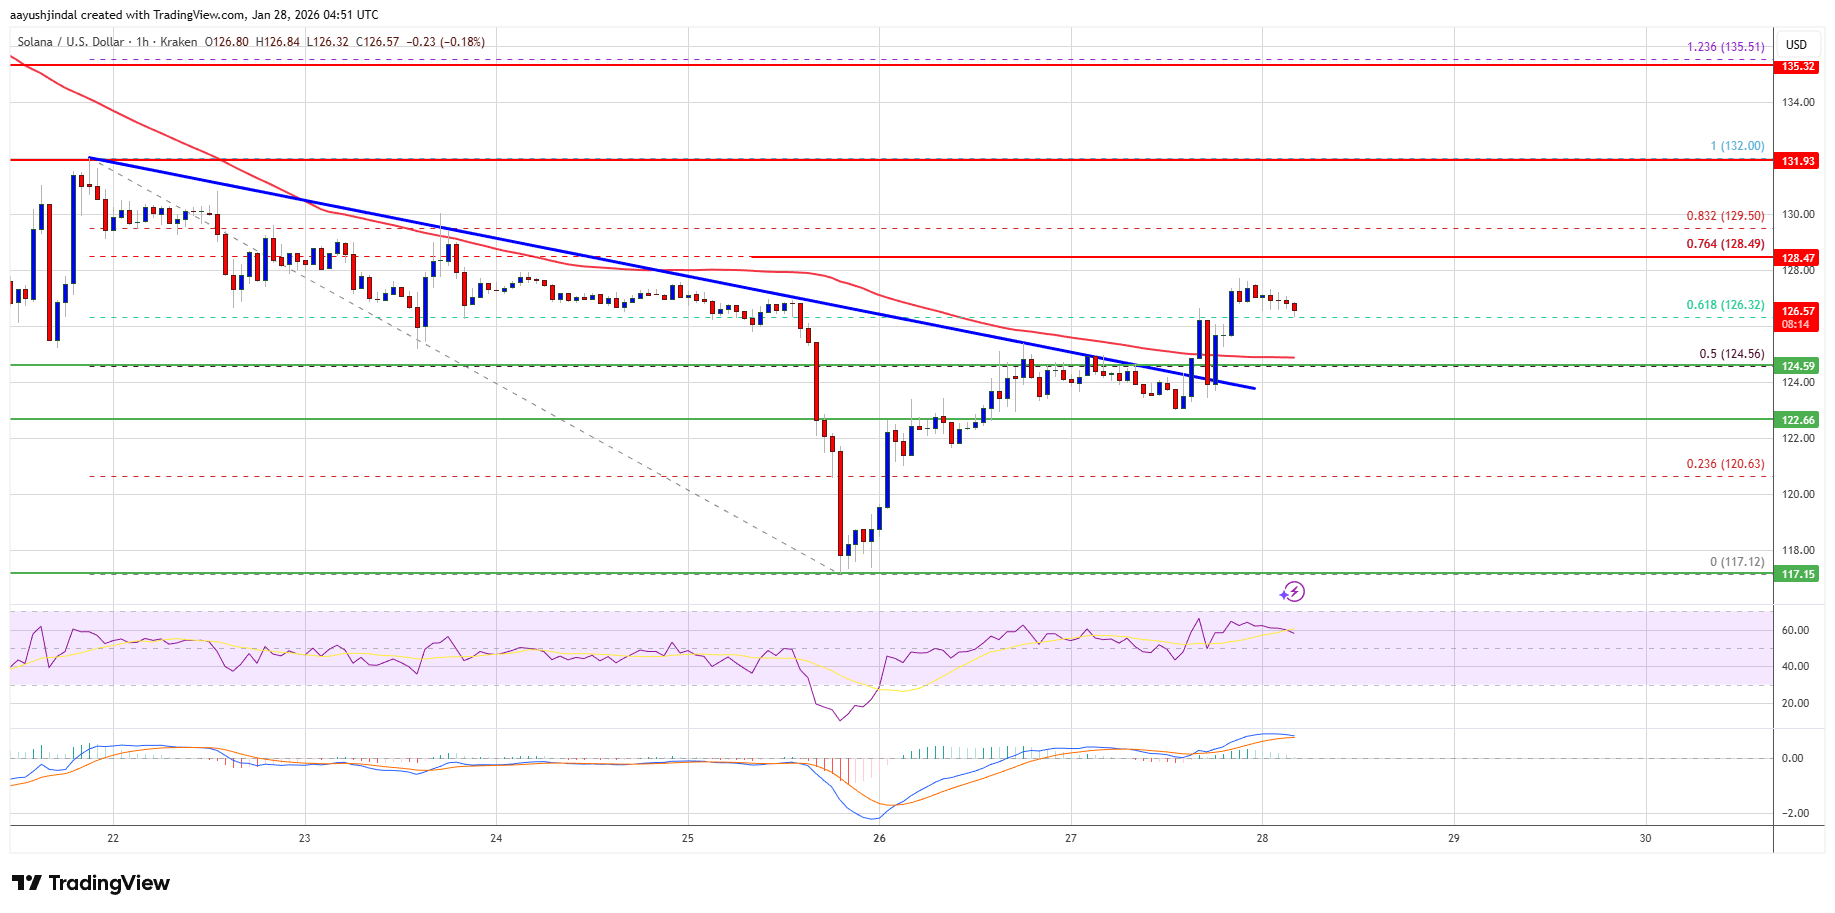
If SOL clears $135, further increases could push it towards $142 and $145. In contrast, failing to surpass $128 might result in a decline, with support at $124.50 and $122. A break below $122 could lead to a decrease towards $117 or even $105.
Technical Indicators
- Hourly MACD for SOL/USD is losing momentum in the bullish zone.
- Hourly RSI for SOL/USD is above the 50 level.
- Major support levels: $125 and $122.
- Major resistance levels: $128 and $130.