Jan 22, 2026
2 0
Solana Price Faces Resistance Below $135 Amid Bearish Trend
Solana (SOL) is experiencing a decline, failing to maintain stability above $140, and is now consolidating below $135.
- SOL initiated a drop below $136 and $135 against the US Dollar.
- Currently trading under $135 and below the 100-hour simple moving average.
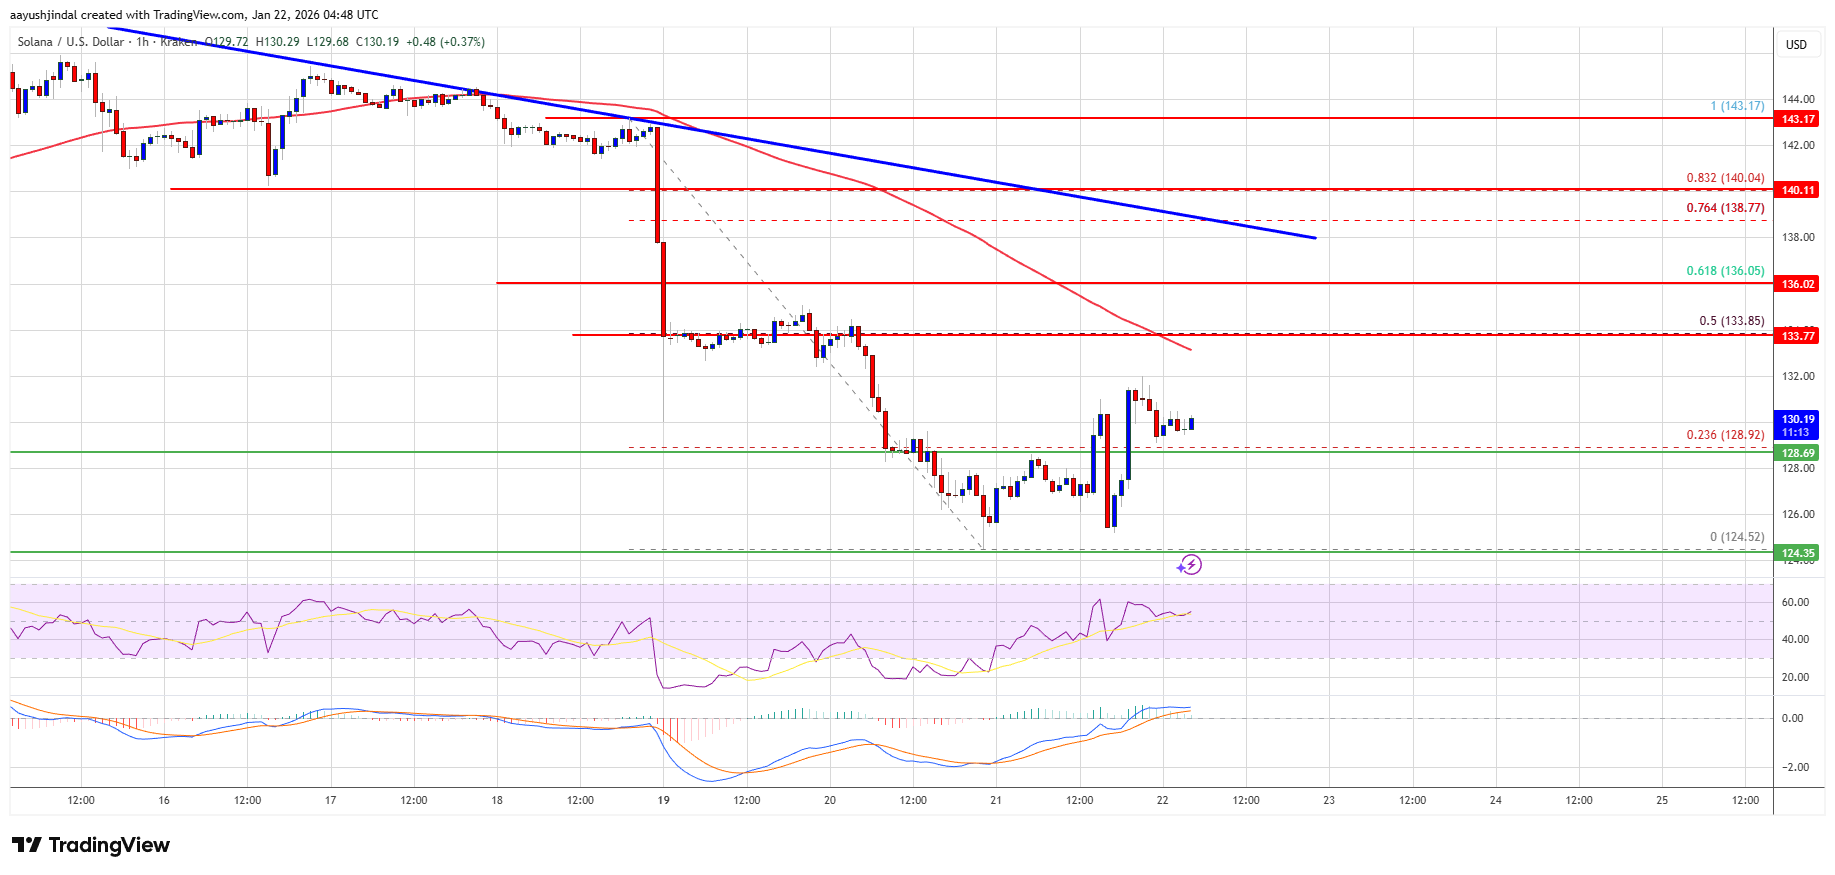
- A bearish trend line with resistance at $138 is noted on the hourly SOL/USD chart from Kraken.
- Potential recovery could occur if bulls defend the $128 or $125 levels.
Price Movement
SOL fell below the $138 and $135 support levels, hitting a low of $124. It then recovered slightly, surpassing the 23.6% Fib retracement level from $143 to $124.
Immediate resistance is near $134, aligning with the 50% Fib retracement level. Major resistance levels are at $136 and $138, with $144 as a subsequent target if breached.
Potential Decline
If SOL doesn't rise above $133, further decline is possible:
- Initial support: $129
- Major support: $125
- Break below $125 may lead to $120, and possibly $112
Technical Indicators
- Hourly MACD: Losing momentum in bearish zone
- Hourly RSI: Above the 50 level
Key Support Levels: $129 and $125
Key Resistance Levels: $133 and $138