Feb 3, 2026
4 0
BEARISH 📉 : Solana struggles to overcome $108 resistance amid price recovery
Solana's price is recovering above $102 after failing to settle above $112. It faces resistance near $108 and $110 as it trades below the 100-hourly simple moving average.
- SOL initiated a recovery wave from $95, similar to [Bitcoin](https://holder.io/coins/btc/) and [Ethereum](https://holder.io/coins/eth/).
- The price surpassed the 23.6% Fib retracement level of its previous decline.
- A bearish trend line provides resistance at $108 on the SOL/USD hourly chart.
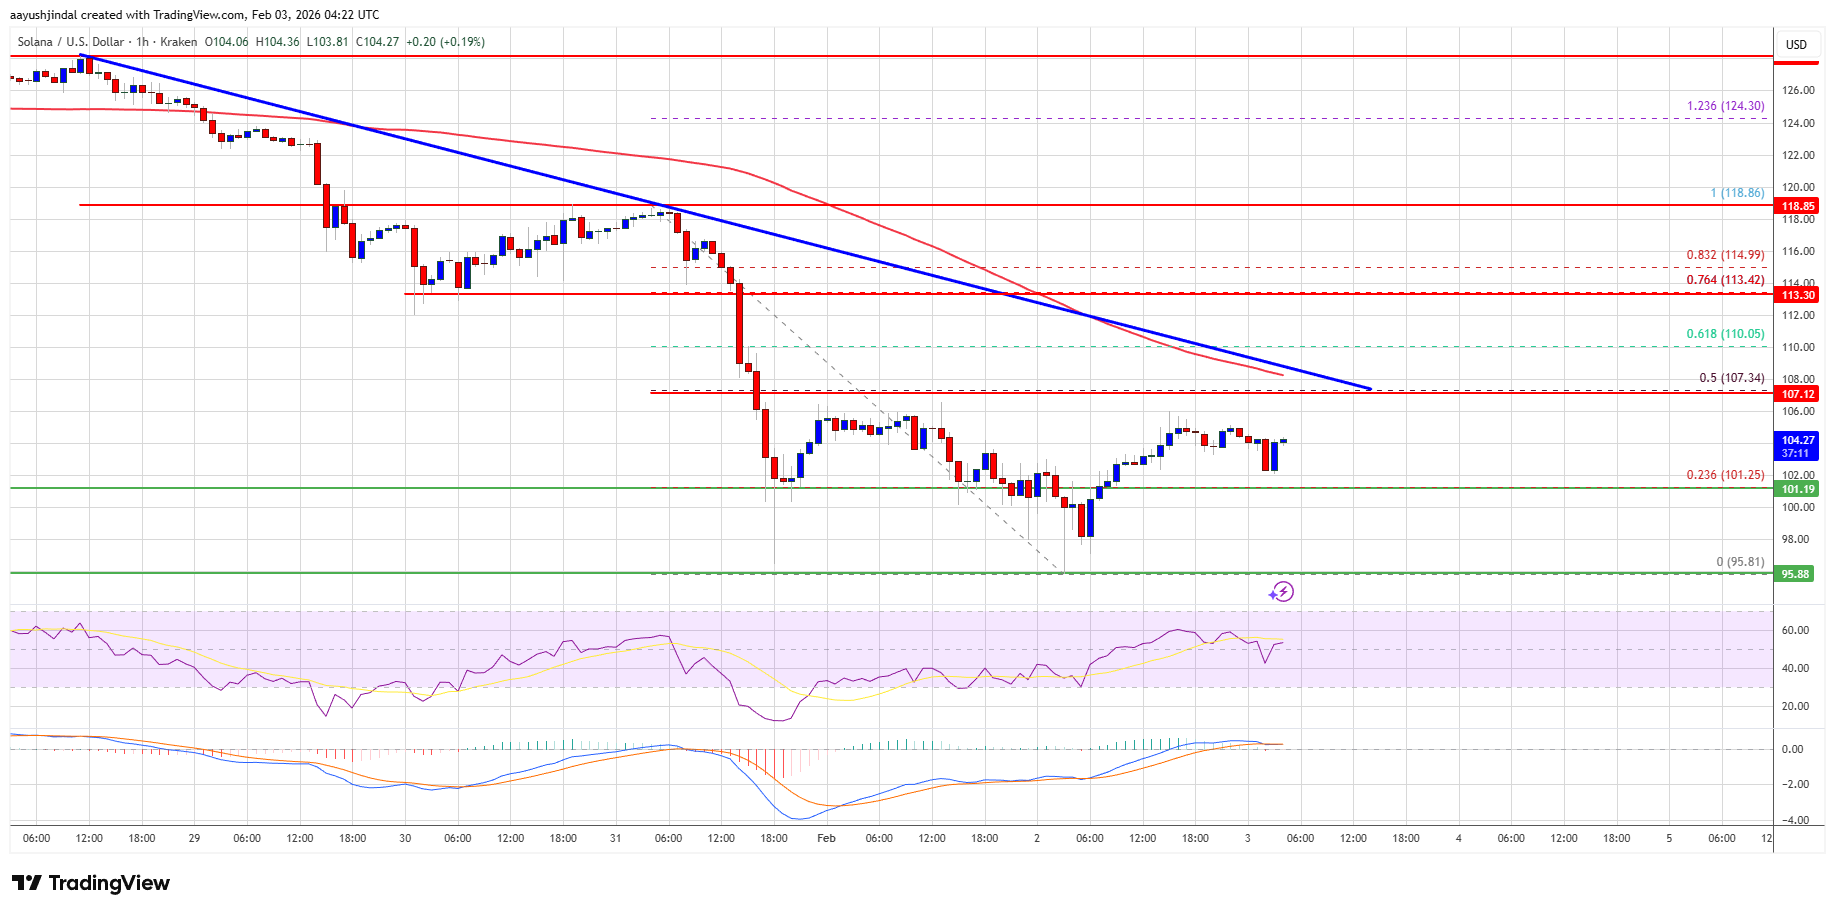
Resistance Levels:
- Immediate resistance is at $108, aligning with the trend line and the 50% Fib retracement level.
- Further resistance is at $110 and potentially at $115, which could lead to a rise towards $122 and $125.
Support Levels:
- Initial downside support is at $101, with significant support at $95.
- A break below $95 might lead to a decline towards $88, and further down to $80.
Technical Indicators:
- Hourly MACD shows bullish momentum for SOL/USD.
- RSI is above 50, indicating positive momentum.