Solana Maintains $209 Support Level Amidst Bearish Pressure
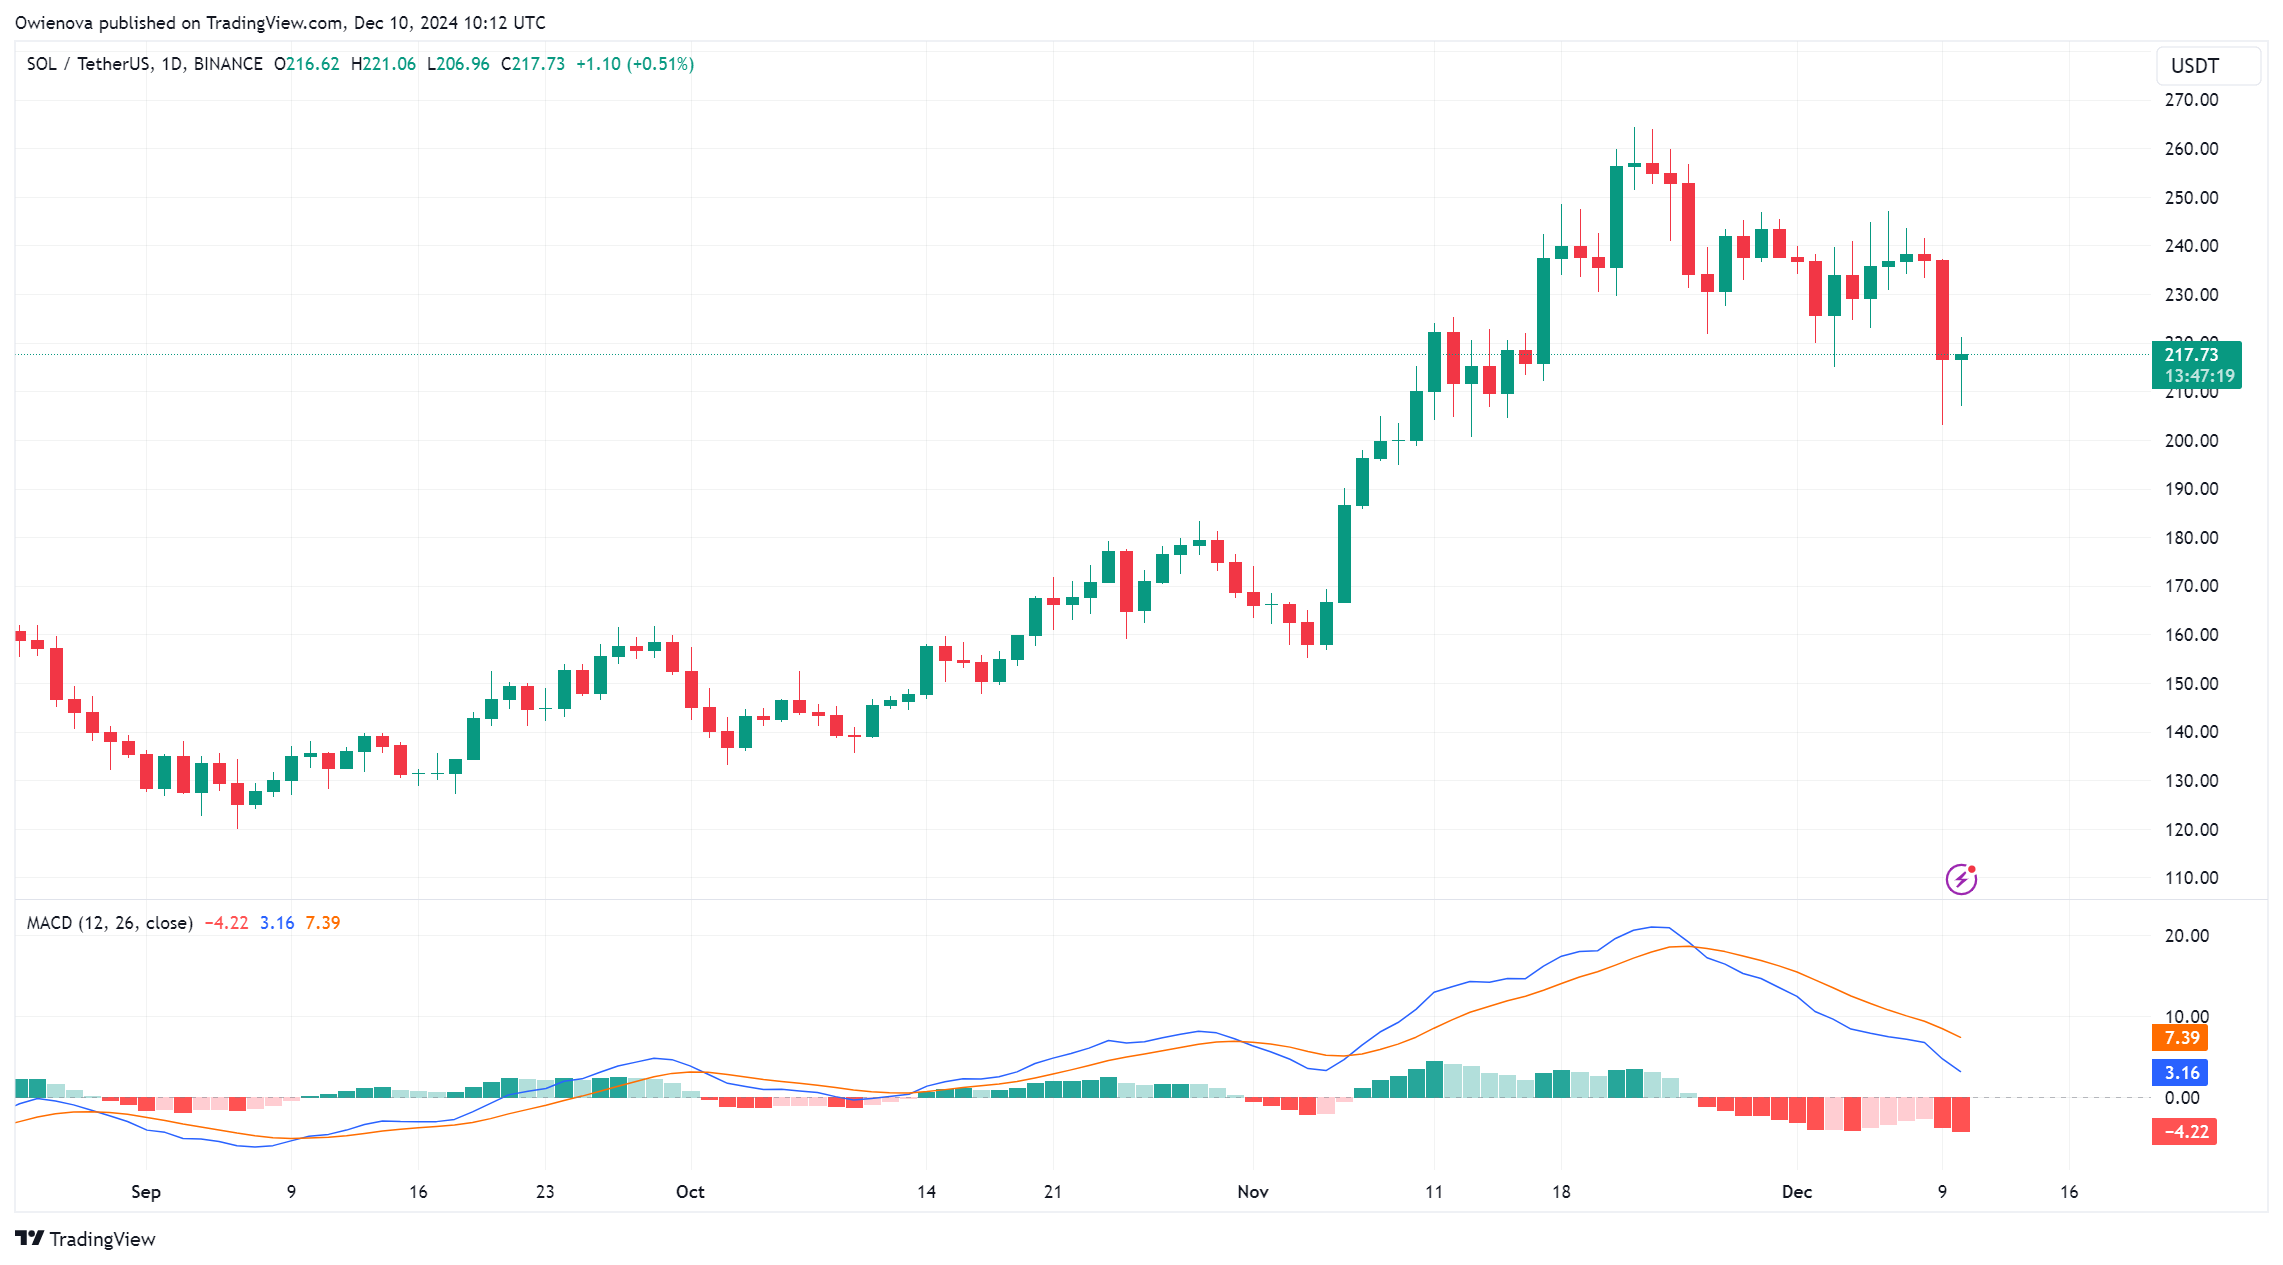
Solana (SOL) remains stable at a crucial $209 support level, with recent bearish trends failing to breach this point. SOL's resilience has led to speculation of a potential rebound. Market dynamics are shifting, and technical indicators present mixed signals, raising the question of whether bulls will drive SOL upward or if further declines will occur.
Bearish Pressure Eases: Can The Solana Bulls Step In?
The reaction at the $209 support level has been significant for Solana, maintaining its bullish structure. Following tests of this level, early signs indicate a possible rebound, suggesting easing bearish pressure and a resurgence of buyer interest.
Market participants are watching for a rally toward the next resistance level at $240. For SOL to maintain upward momentum, it must overcome nearby resistance zones at $240 and $260. Success in surpassing these levels could initiate a broader uptrend. However, if the rebound fails, retesting the $209 support may heighten the risk of a deeper correction. Current indications of recovery offer optimism for Solana's potential upward movement in upcoming sessions.
Technical Indicators Signal A Potential Turnaround
The 4-hour Relative Strength Index (RSI) has entered the oversold zone, typically indicating increased selling pressure and potential exhaustion of the bearish trend. The RSI is currently attempting to rise, hinting at a possible momentum shift as buying interest reemerges.
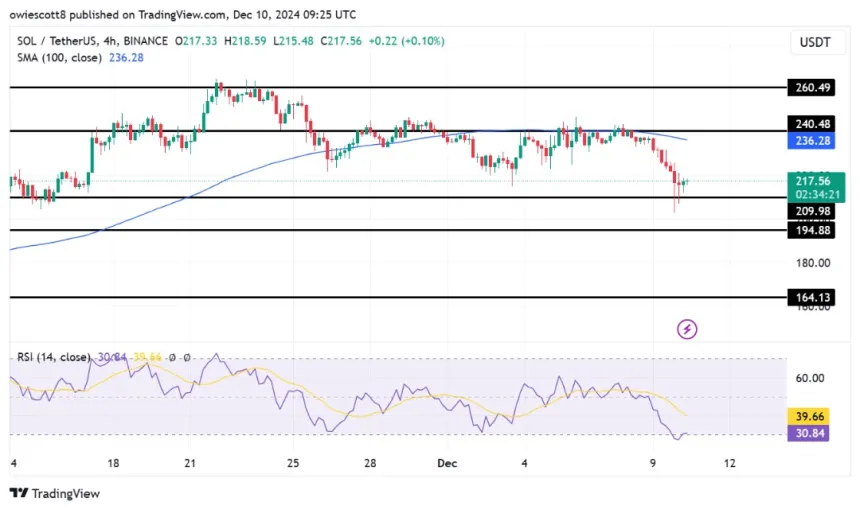
A move out of the oversold territory is generally viewed as a bullish signal, suggesting sellers may be losing control and allowing buyers to regain dominance. If the RSI rises above the oversold threshold, it could trigger a larger recovery phase, especially if accompanied by increasing volume and positive price action.
Additionally, Solana's price continues to trade above the 1-day 100-day Simple Moving Average (SMA), indicating a broader bullish trajectory despite market fluctuations.
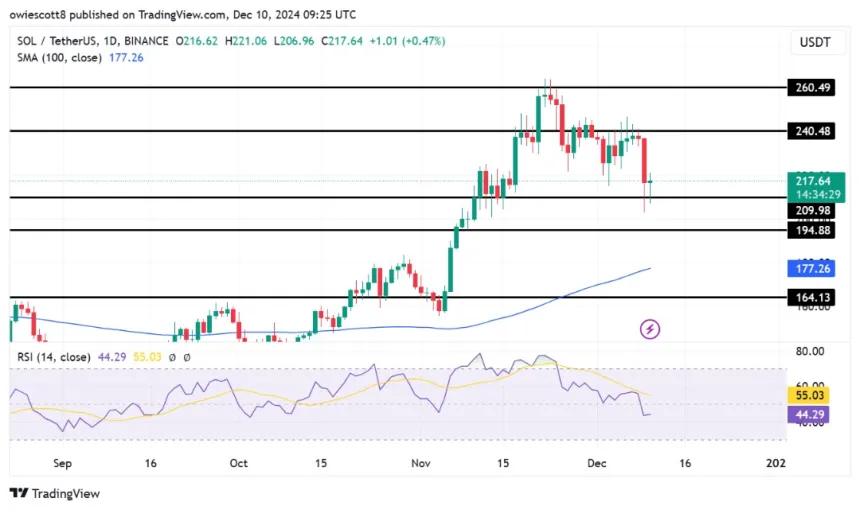
Staying above this moving average suggests sustained optimistic sentiment, even during short-term corrections. This threshold serves as a critical point where buyers are likely to enter, reinforcing prices and preventing declines. Historically, remaining above the 100-day SMA has often preceded significant upward movements, making it a key indicator for market participants.