Feb 8, 2025
13 0
Solana Maintains Support Above Key Indicators Amid Market Volatility
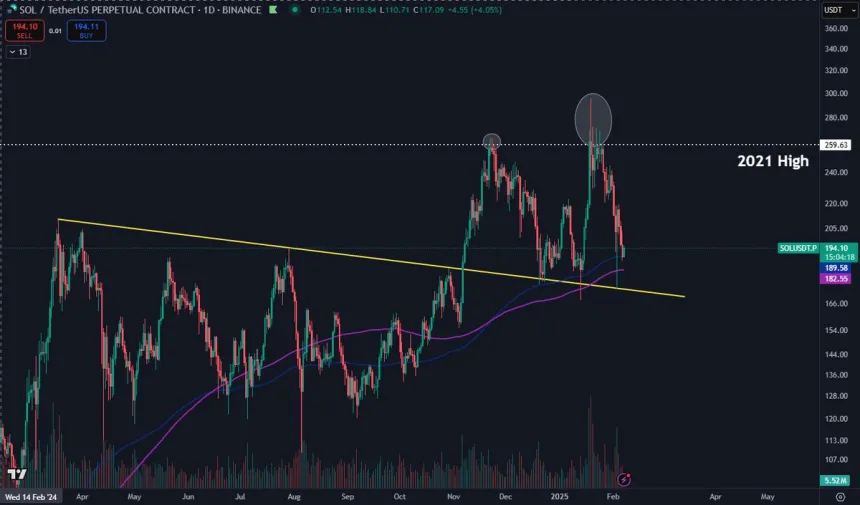
Solana (SOL) has experienced a decline of over 40% since reaching all-time highs in January, with current trading at $192. The asset is facing bearish price action and testing critical support levels.
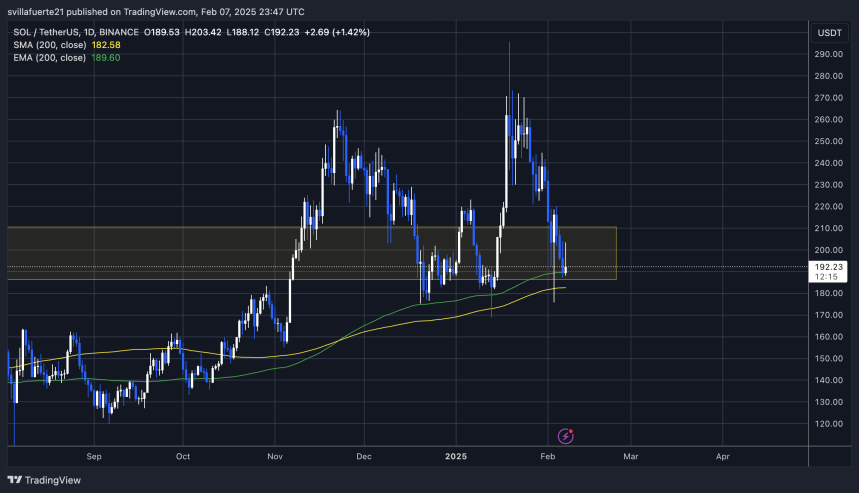
- Technical indicators show SOL is above a key diagonal trend line and the Daily 200MA/EMA.
- Maintaining these levels could allow for a potential recovery towards previous highs.
- If SOL fails to hold above these supports, further declines may occur, possibly dropping to around $170.
- A bounce from current levels may signify the beginning of a new bullish phase.
Analysts highlight that defending the 200-day EMA is crucial. A successful rally past the psychological $200 mark would indicate strength. Conversely, a failure to maintain support could lead to deeper corrections.