Jun 7, 2025
3 0
Solana’s TD Sequential Indicator Issues Buy Signal on Daily Chart
Solana (SOL) is stabilizing above $145 after a 20% correction since late May, showing resilience amid broader market volatility. This key demand zone may serve as a launchpad for potential price increases.
Key points include:
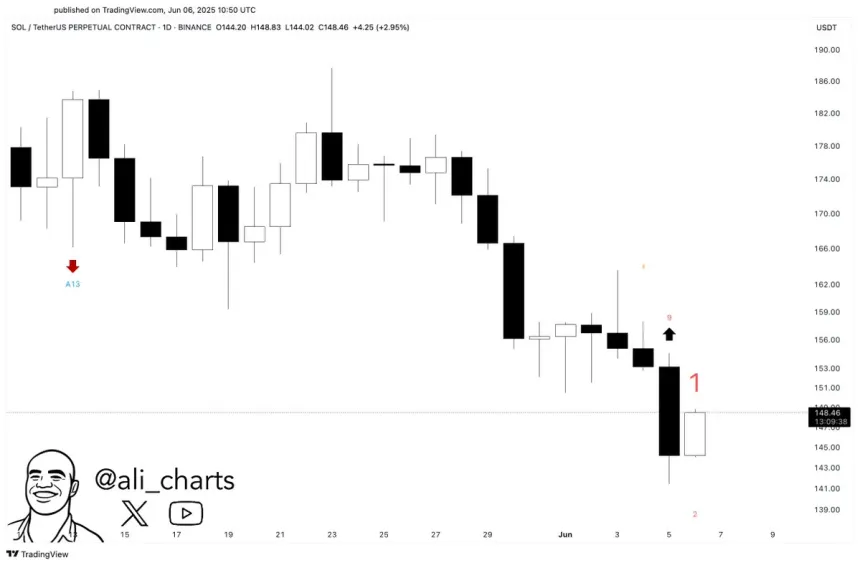
- Analyst Ali Martinez noted a buy signal from the TD Sequential indicator on the daily chart, historically linked to bullish reversals.
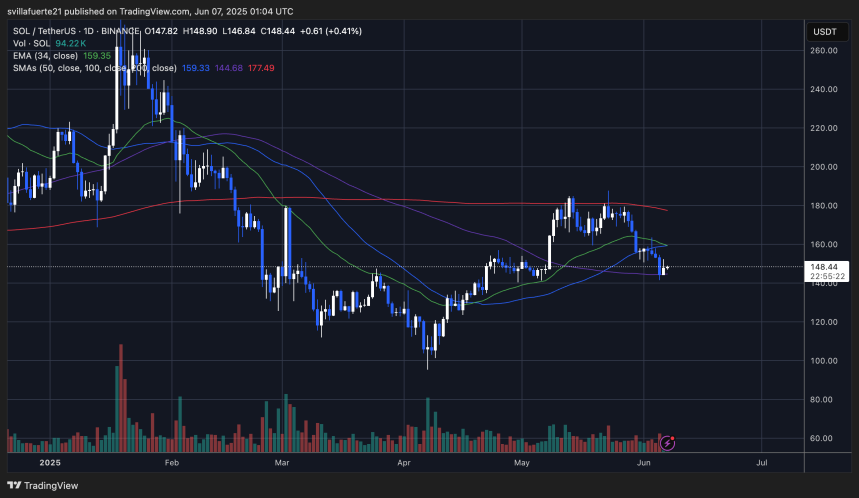
- Solana faces resistance around $160 and has struggled to reclaim this level, with rising macro risks affecting short-term performance.
- The 100-day moving average is currently at $144.68, acting as support, while the 50-day and 34-day moving averages are both around $159, presenting dynamic resistance.
- Lack of significant panic selling suggests a possible rebound if SOL holds above the $144–$145 range.
- A daily close above the 34-EMA could signal recovery towards $160, while a drop below $144 may lead to further declines.