SUI Aims for $2.18 as Bullish Momentum Increases
SUI is experiencing bullish momentum, approaching a target of $2.1825 after rebounding from the $1.5 support level. Market activity indicates a potential upswing for traders and investors.
SUI Bullish Surge Aims At $2.1825 Mark
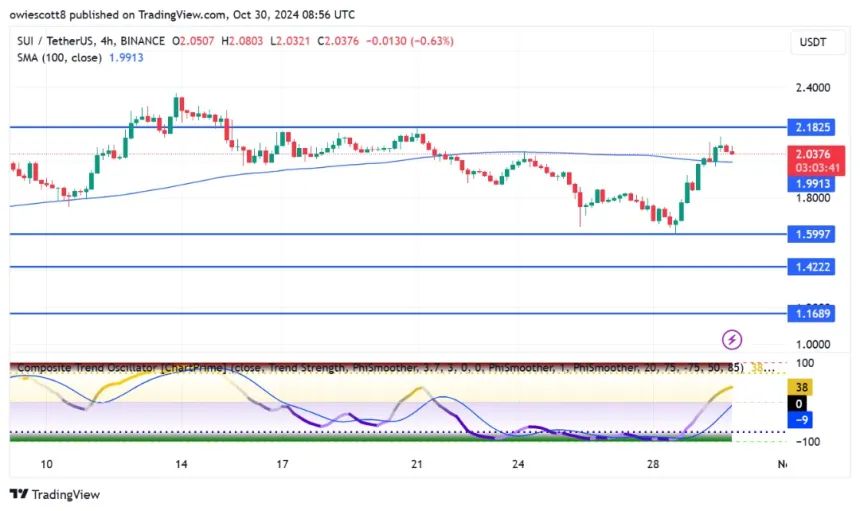
After recovering at $1.5, SUI's price on the 4-hour chart shows continued upward pressure towards $2.18. The asset has surpassed the 100-day Simple Moving Average (SMA), indicating a strengthening trend that may lead to a breakout.

The 4-hour Composite Trend Oscillator indicates a bullish trend, with SMA and signal lines above the zero line, suggesting strong buying interest as SUI approaches key resistance levels.
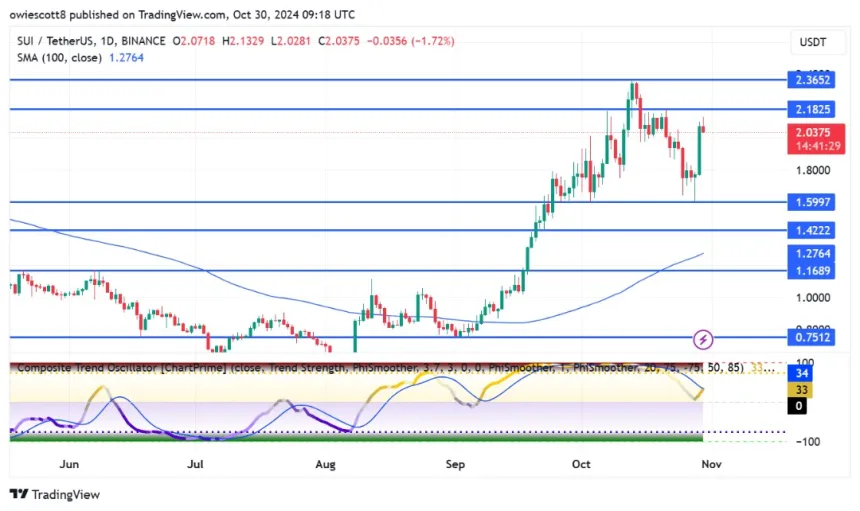
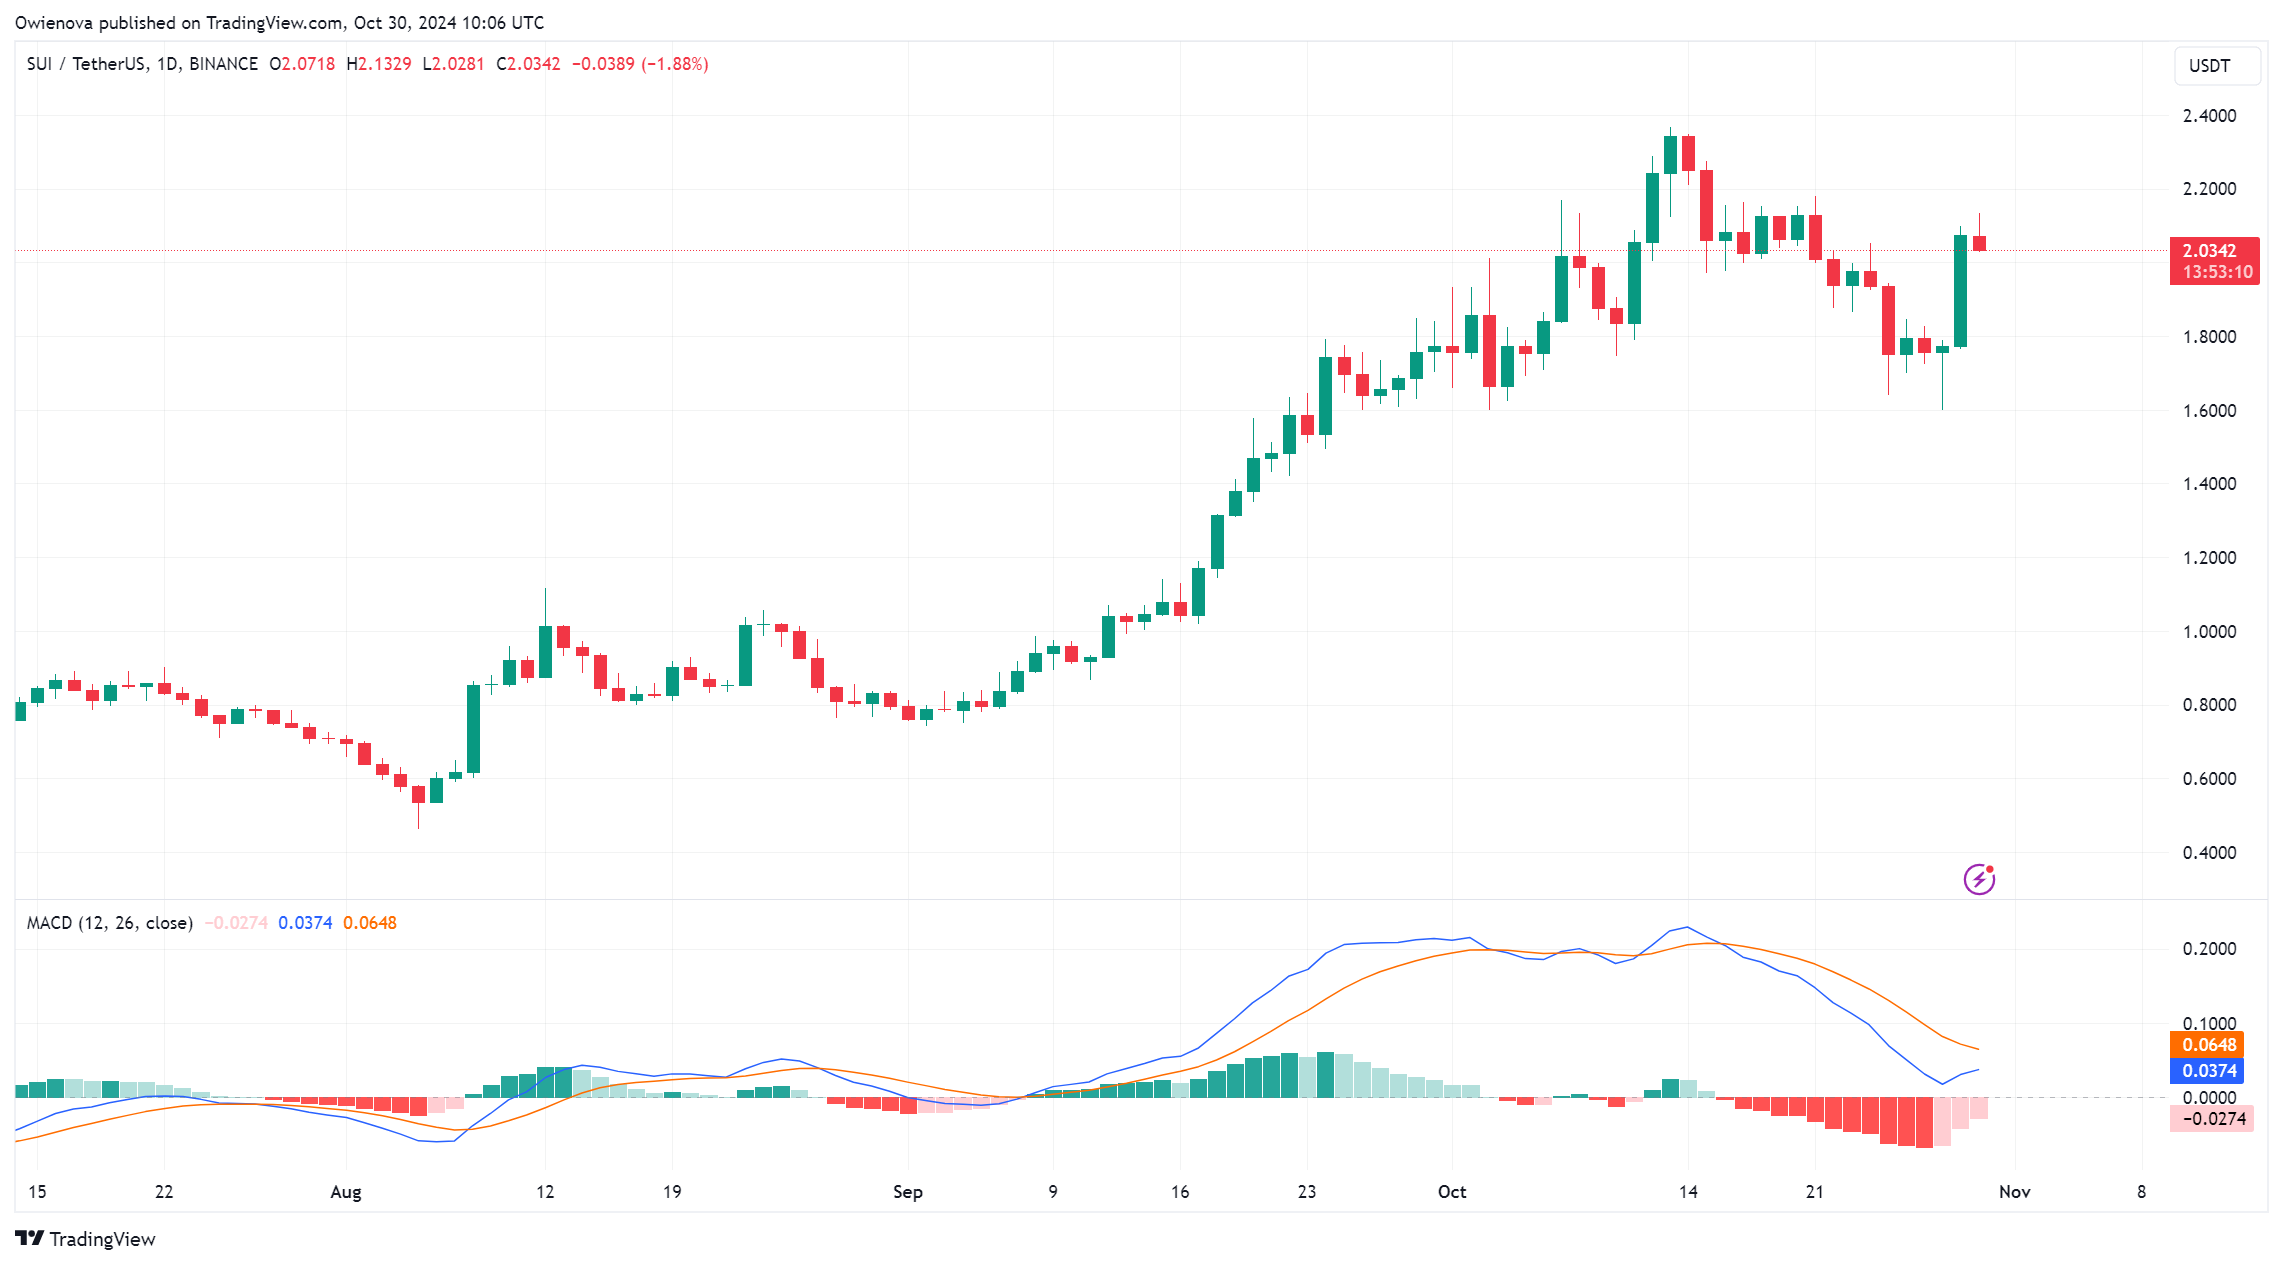
On the daily chart, SUI shows firm upward momentum with a bullish candlestick pattern following the rebound at $1.5. Trading above the 100-day SMA confirms an optimistic phase, with previous resistance now acting as support for further gains.

Analysis of the Composite Trend Oscillator on the daily chart shows bullish movement, with the indicator's signal line aiming to cross above the SMA line, indicating building positive sentiment and potential for price increases.
Support And Resistance Levels To Watch
Resistance around $2.18 is the next hurdle for SUI. A successful break above this level could lead to higher targets, including an all-time high of $2.36. Conversely, failure to surpass the $2.18 resistance may result in a decline toward $1.5, with further potential drops to the $1.42 support level.
