Sep 6, 2025
7 0
SUI Bulls Aim for $3.50 Following Key Chart Pattern Breakout
Bulls in the SUI market have broken out of a key technical chart pattern, targeting resistance at $3.50. This indicates a shift towards an upward trend.
Technical Setup Indicates Further Upside
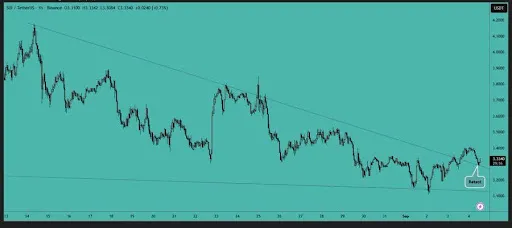
- SUI has maintained bullish momentum, breaking out of a falling wedge pattern.
- The breakout suggests a transition from consolidation to renewed upward strength.
- SUI successfully retested the support line, confirming the breakout's validity.
- This resilience demonstrates the market's ability to absorb selling pressure.
Key resistance is noted at $3.50; breaking this level could attract more buyers and further extend SUI's upward trajectory.
SUI Indicators Align for Continued Potential Upside
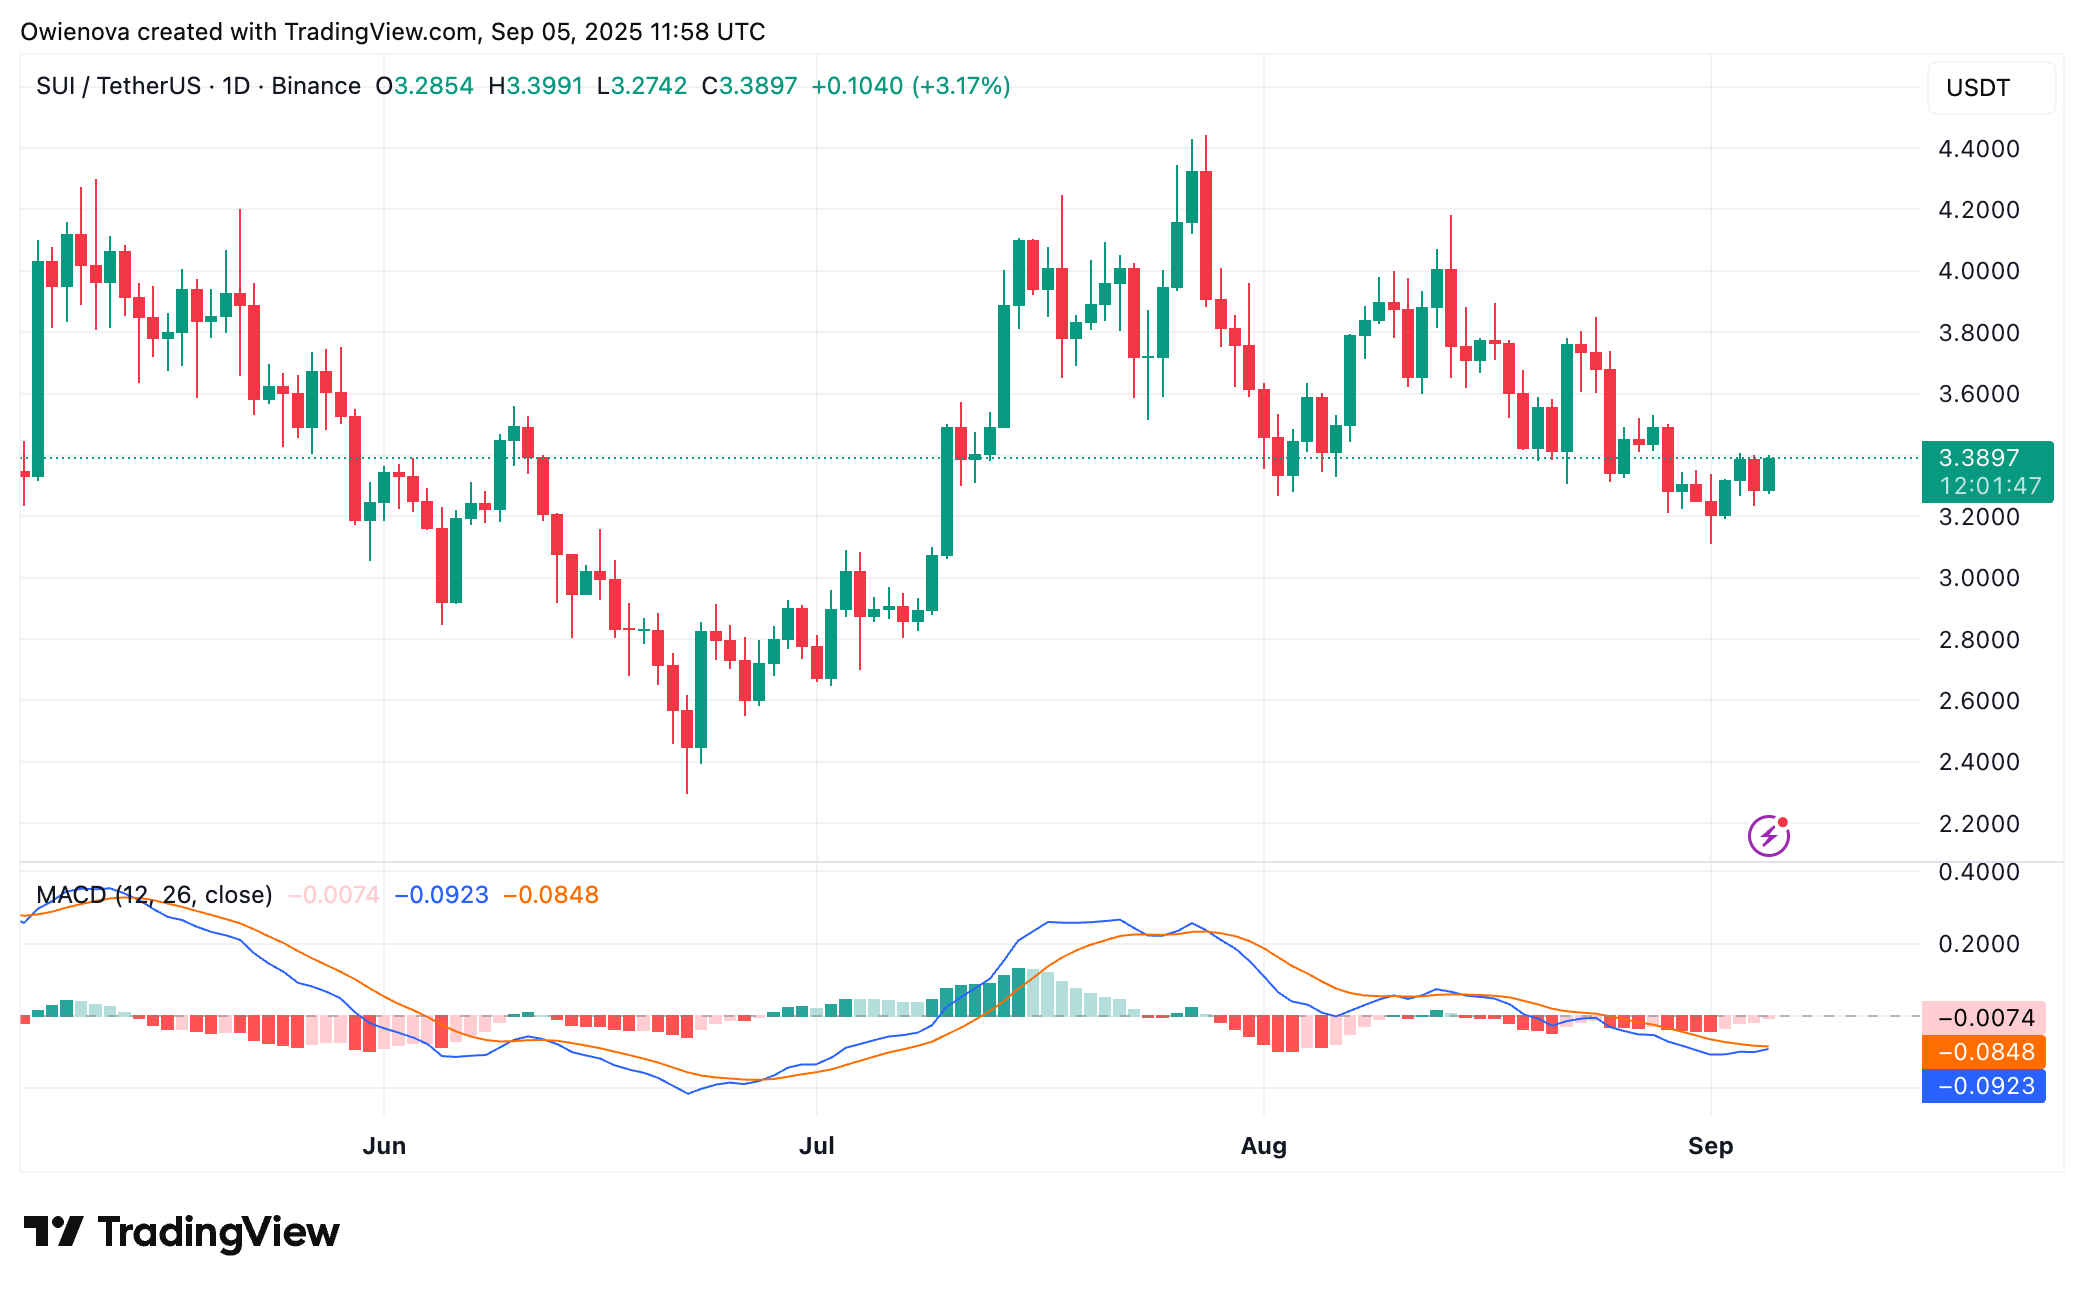
- SUI's price has crossed above the 5-day and 10-day moving averages, indicating continued upward pressure.
- Resistance is positioned near $3.35, crucial for maintaining the bullish breakout.
- Strong support exists around $3.20, essential for sustaining market confidence.
- RSI is rising from oversold territory, showing renewed buying interest.
- MACD has confirmed a bullish crossover, suggesting potential for another upward push.