Jun 15, 2025
16 2
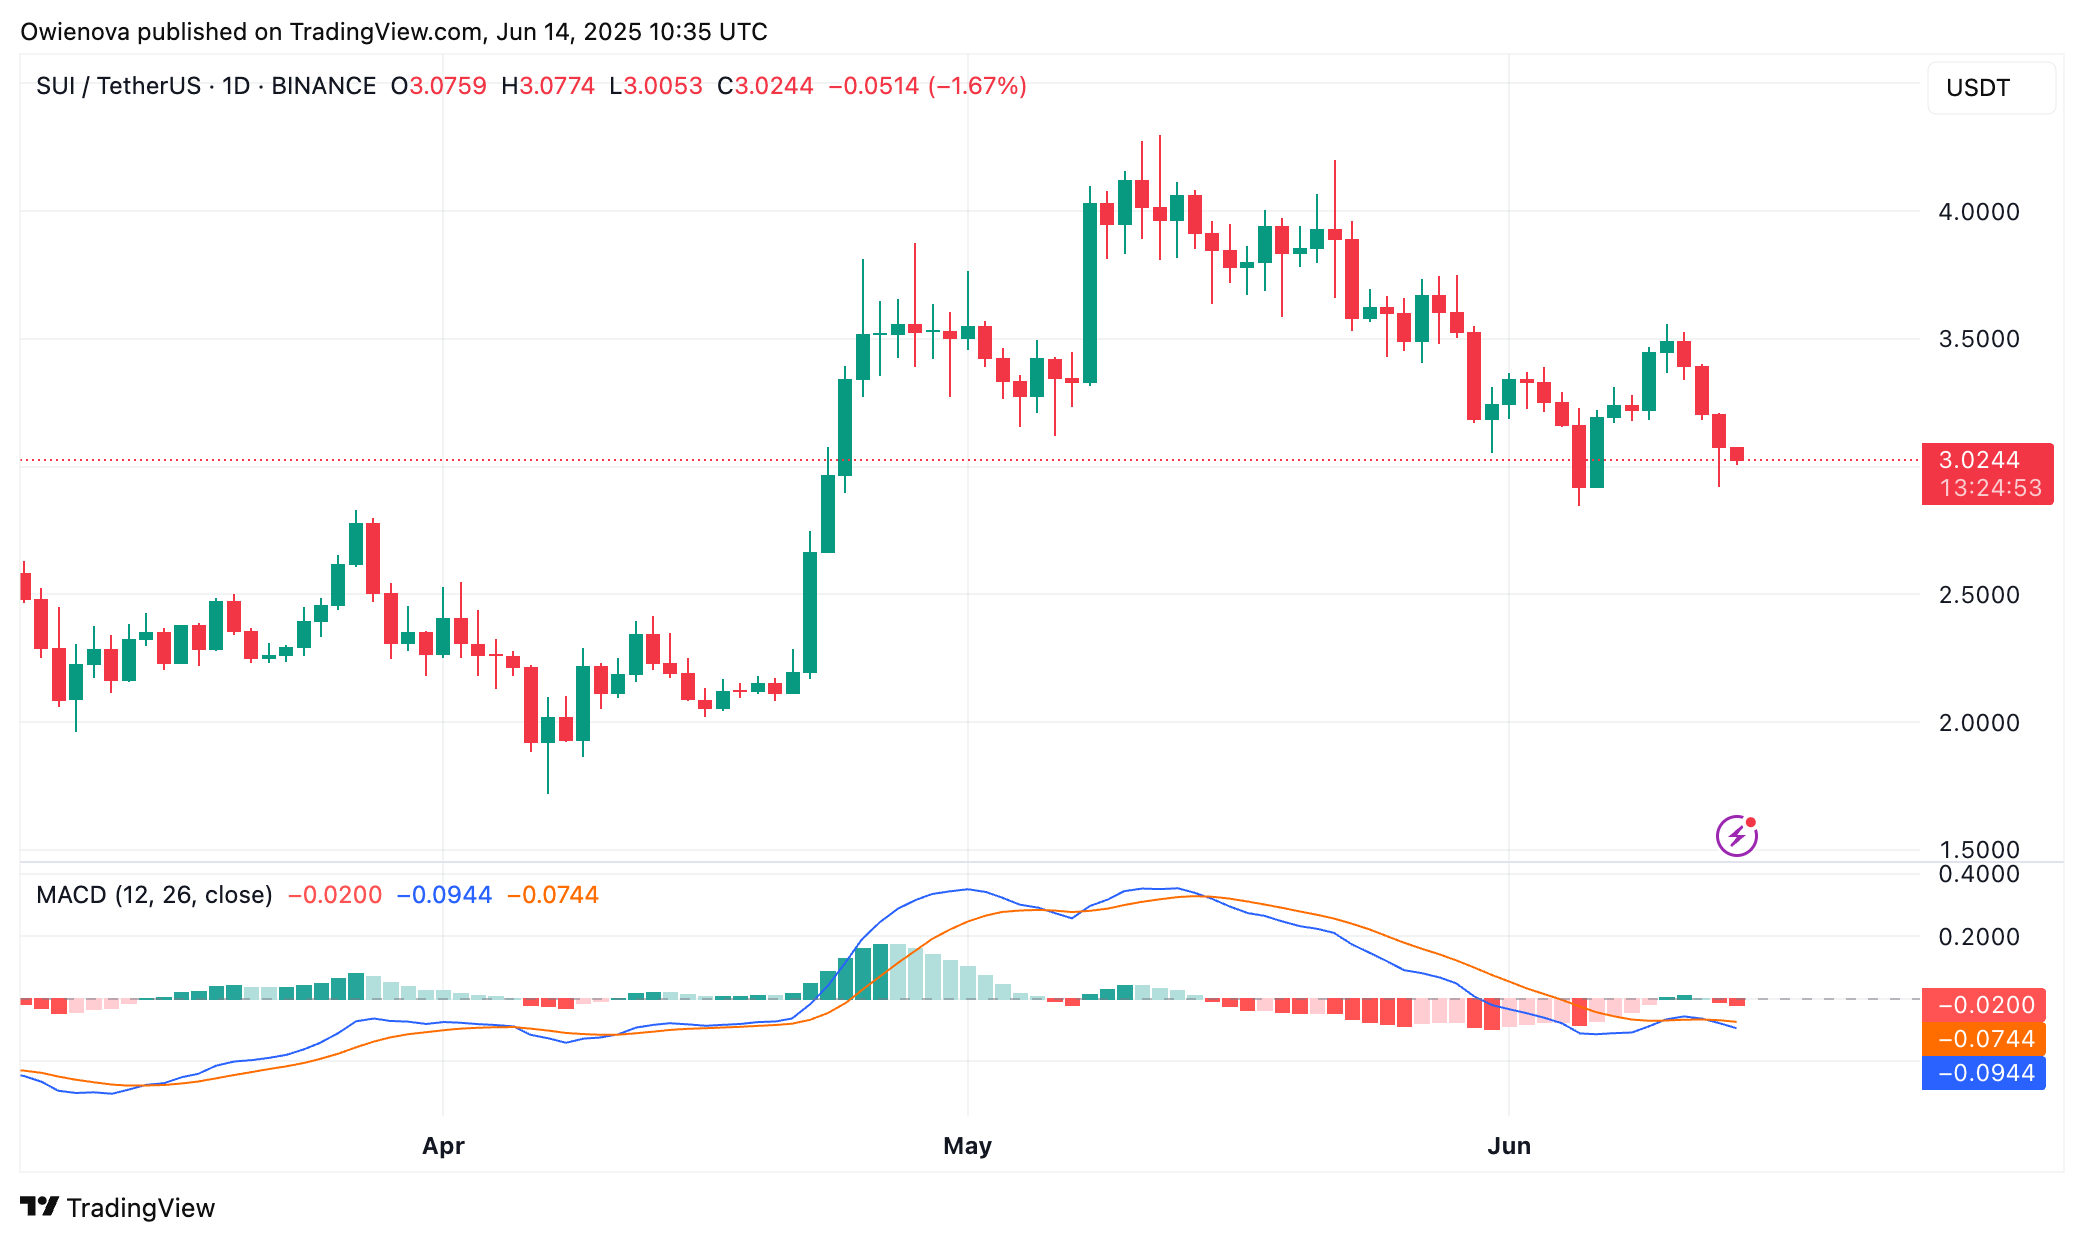
SUI Price Action Forms Inverse Head and Shoulders Pattern
SUI is showing signs of a potential reversal with the formation of an Inverse Head and Shoulders pattern, a typical bullish signal. Key points include:
- Price dipped from $3.74 to $3.00 on May 29-31, marking initial correction.
- A bounce to $3.39 on June 3 established the first neckline.
- Price dropped to $2.84 on June 5, forming the "head" of the pattern.
- Recovery to $3.55 on June 10 reinforced the setup.
- Final dip to $2.91 on June 13 validated the Inverse Head and Shoulders formation.
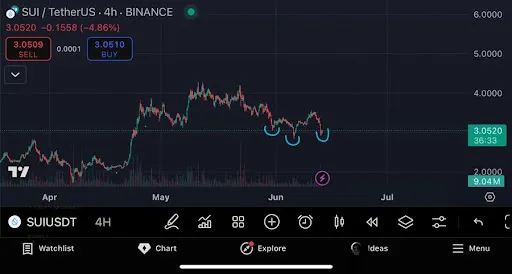
Currently trading at $3.04, the setup suggests potential for upward movement. An analyst noted that both 4-hour and daily charts indicate a breakout might be approaching due to consistent price action within defined support and resistance zones.
- Analyst leans bullish, indicating significant upside if momentum shifts.
- Current range viewed as a solid accumulation zone.
- Caution advised due to global economic factors affecting market sentiment.