SUI Price Analysis Indicates 150% Upside Potential
The total crypto market cap (excluding Bitcoin and Ethereum) has reached $1.04 trillion, with altcoins leading the rally. Notably, SUI has shown a bullish reversal over three consecutive days.
SUI Price Analysis
- SUI's price displays a morning sharp pattern indicating a strong momentum shift.
- SUI started a bullish trend at $3.65, achieving an 11.49% increase recently.
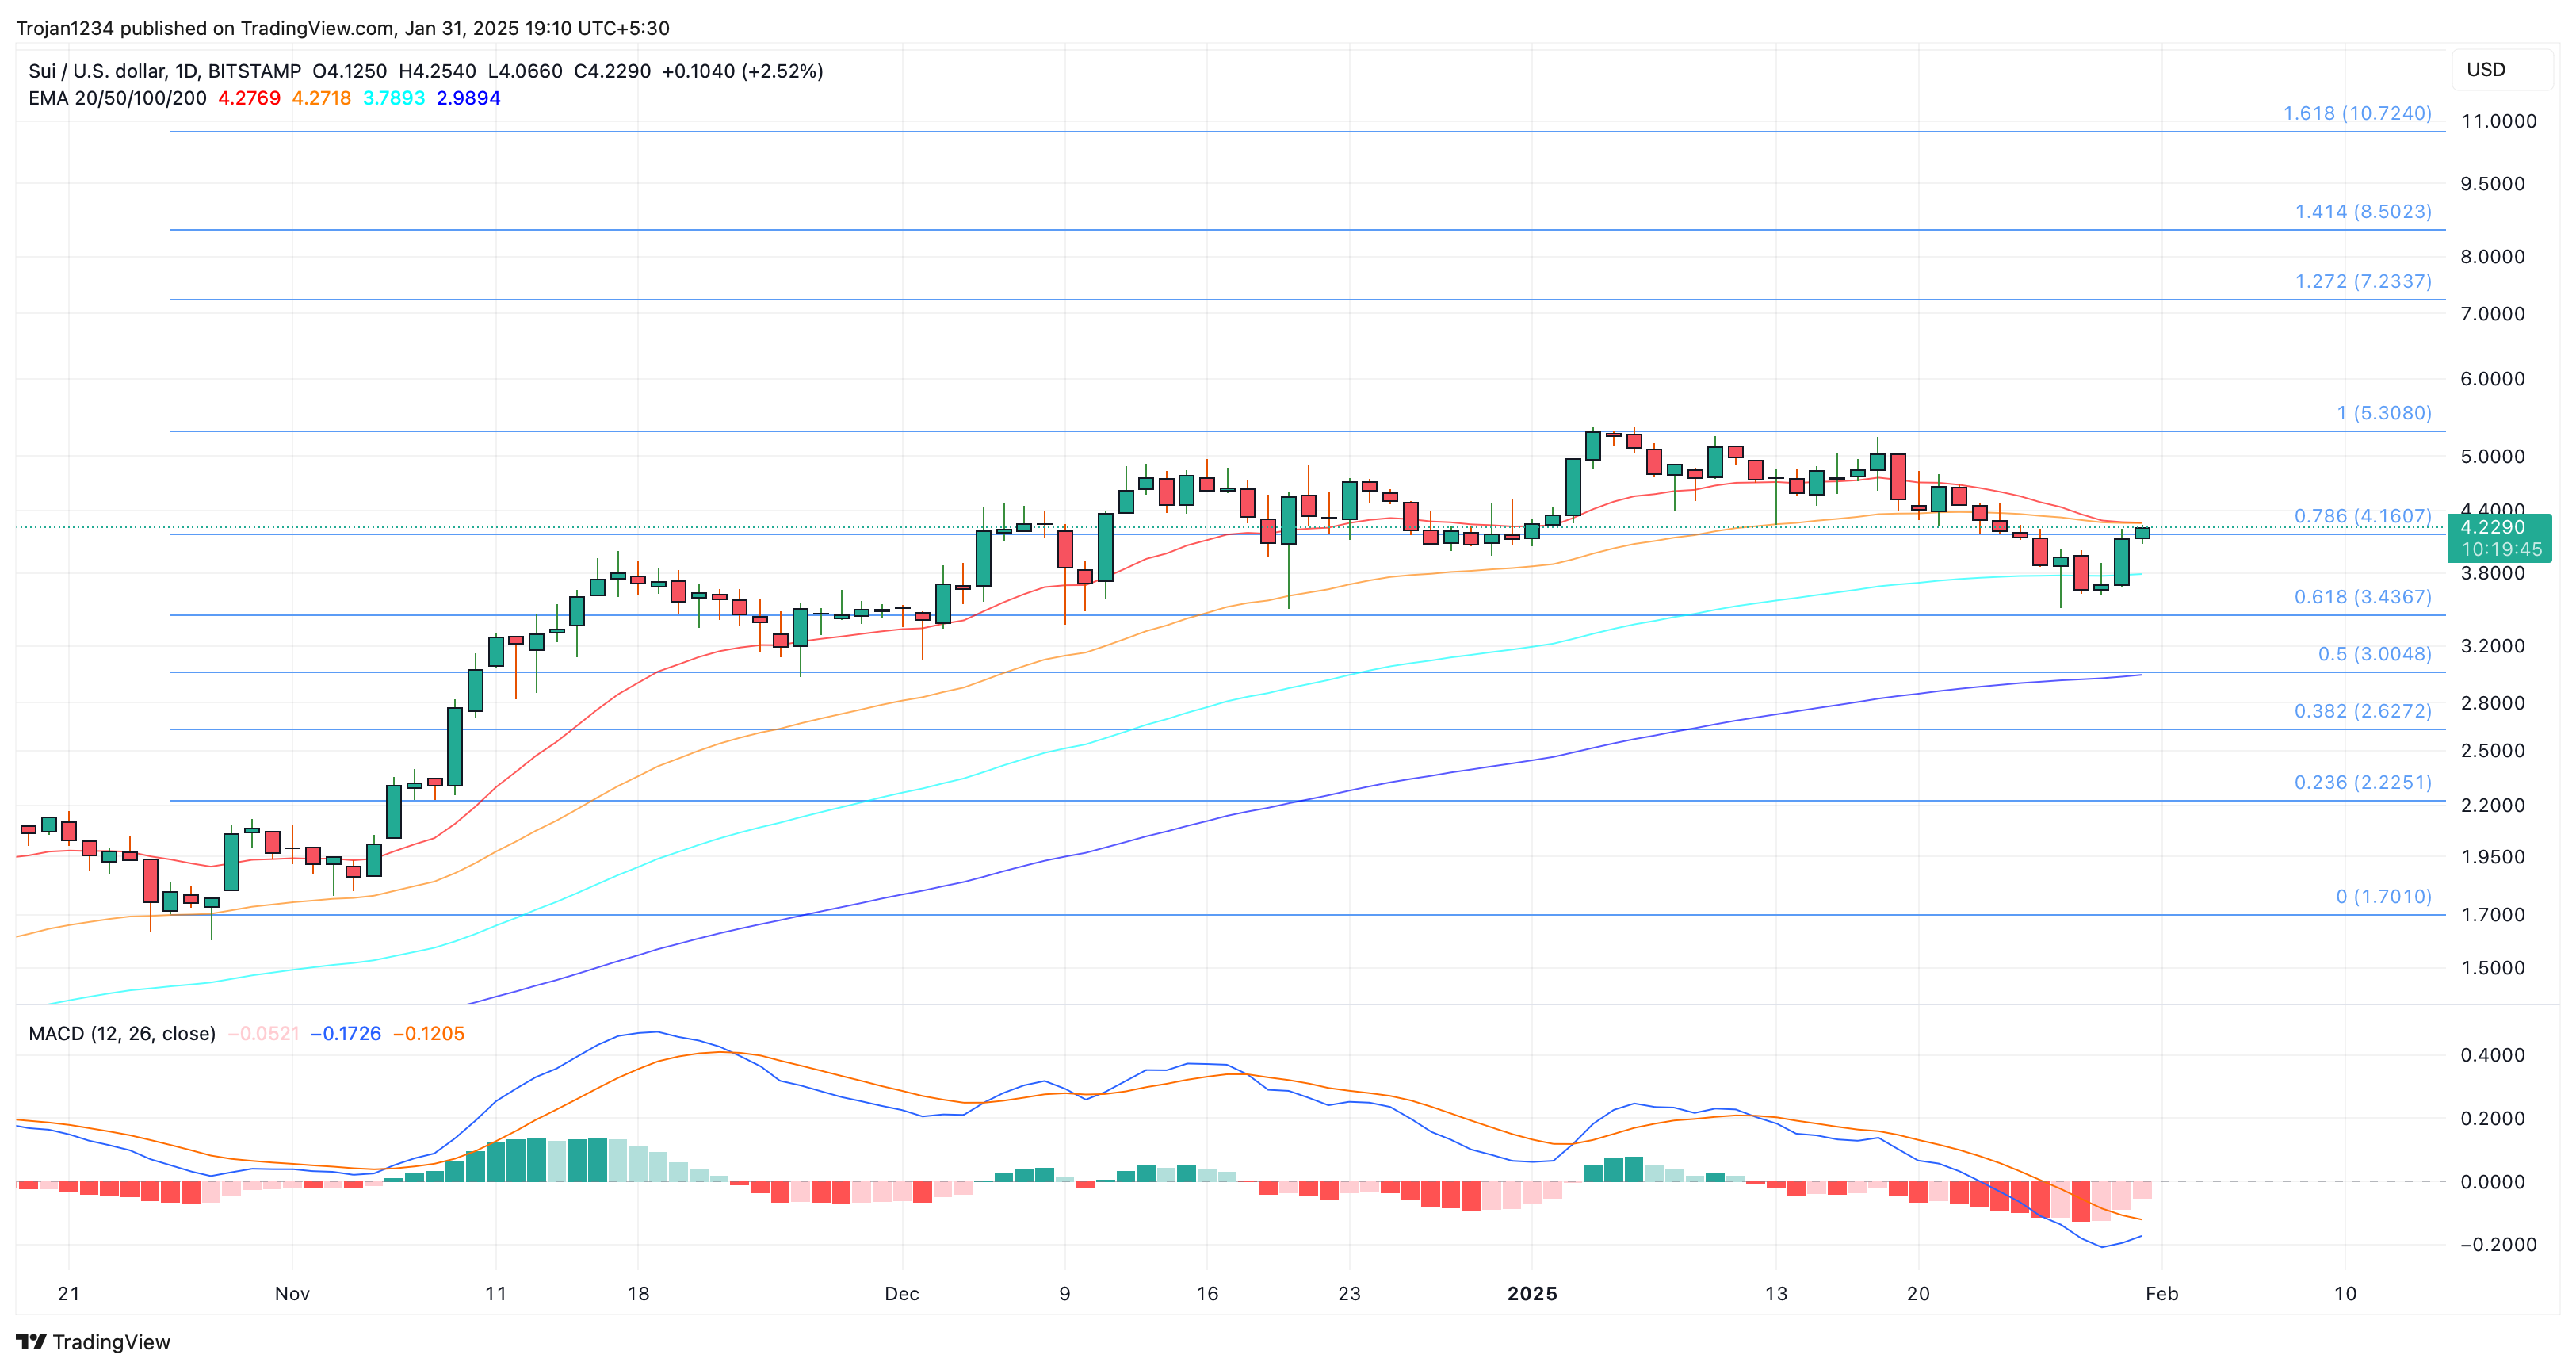
- Current market value is $4.23, with a 2.55% intraday rise.
- The token has broken past the 78.60% Fibonacci level at $4.16, reinforcing the uptrend.
- Potential key targets are set at $8.50 or $10.70, suggesting an upside of nearly 150%.
Technical Indicators
- MACD indicates a possible bullish crossover; however, resistance from the 20 and 50-day EMA lines remains.
- A close above $4.40 could challenge the previous all-time high near $5.30.
Market Sentiment
- Analyst Ali Martinez reports a buy signal on SUI using the TD Sequential Indicator.
- A potential double-bottom reversal pattern hints at a long-term trend shift.
- Recent price recovery has reclaimed an ascending trend line, suggesting further upward movement.
- Increased trading volume will be crucial for validating this bullish trend.