Jun 20, 2025
5 0
SUI Price Chart Indicates Potential Parabolic Move Ahead
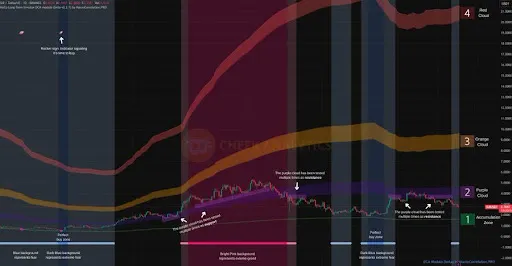
SUI's price chart indicates changing market sentiment, with expanding cloud zones reflecting shifts from accumulation to resistance levels. Analysts suggest a potential parabolic move is possible.
Key Price Levels for SUI
- Cheek Analytics identifies $1.57 as a fundamental buy zone. Historical data shows gains of 957% if bought at this level on August 3, 2024, and 134% from an April 7, 2025 setup.
- The Purple Cloud around $4 is seen as the first major resistance. A break above this level is crucial for bullish momentum.
- The Orange Cloud at $9 is noted as a critical resistance area post-purple zone breakthrough. Previous attempts to surpass it faced profit-taking after reaching extreme greed.
- The long-term target is the Red Cloud at $20, contingent on the orange cloud turning into support.
Outlook on Resistance Breakthrough
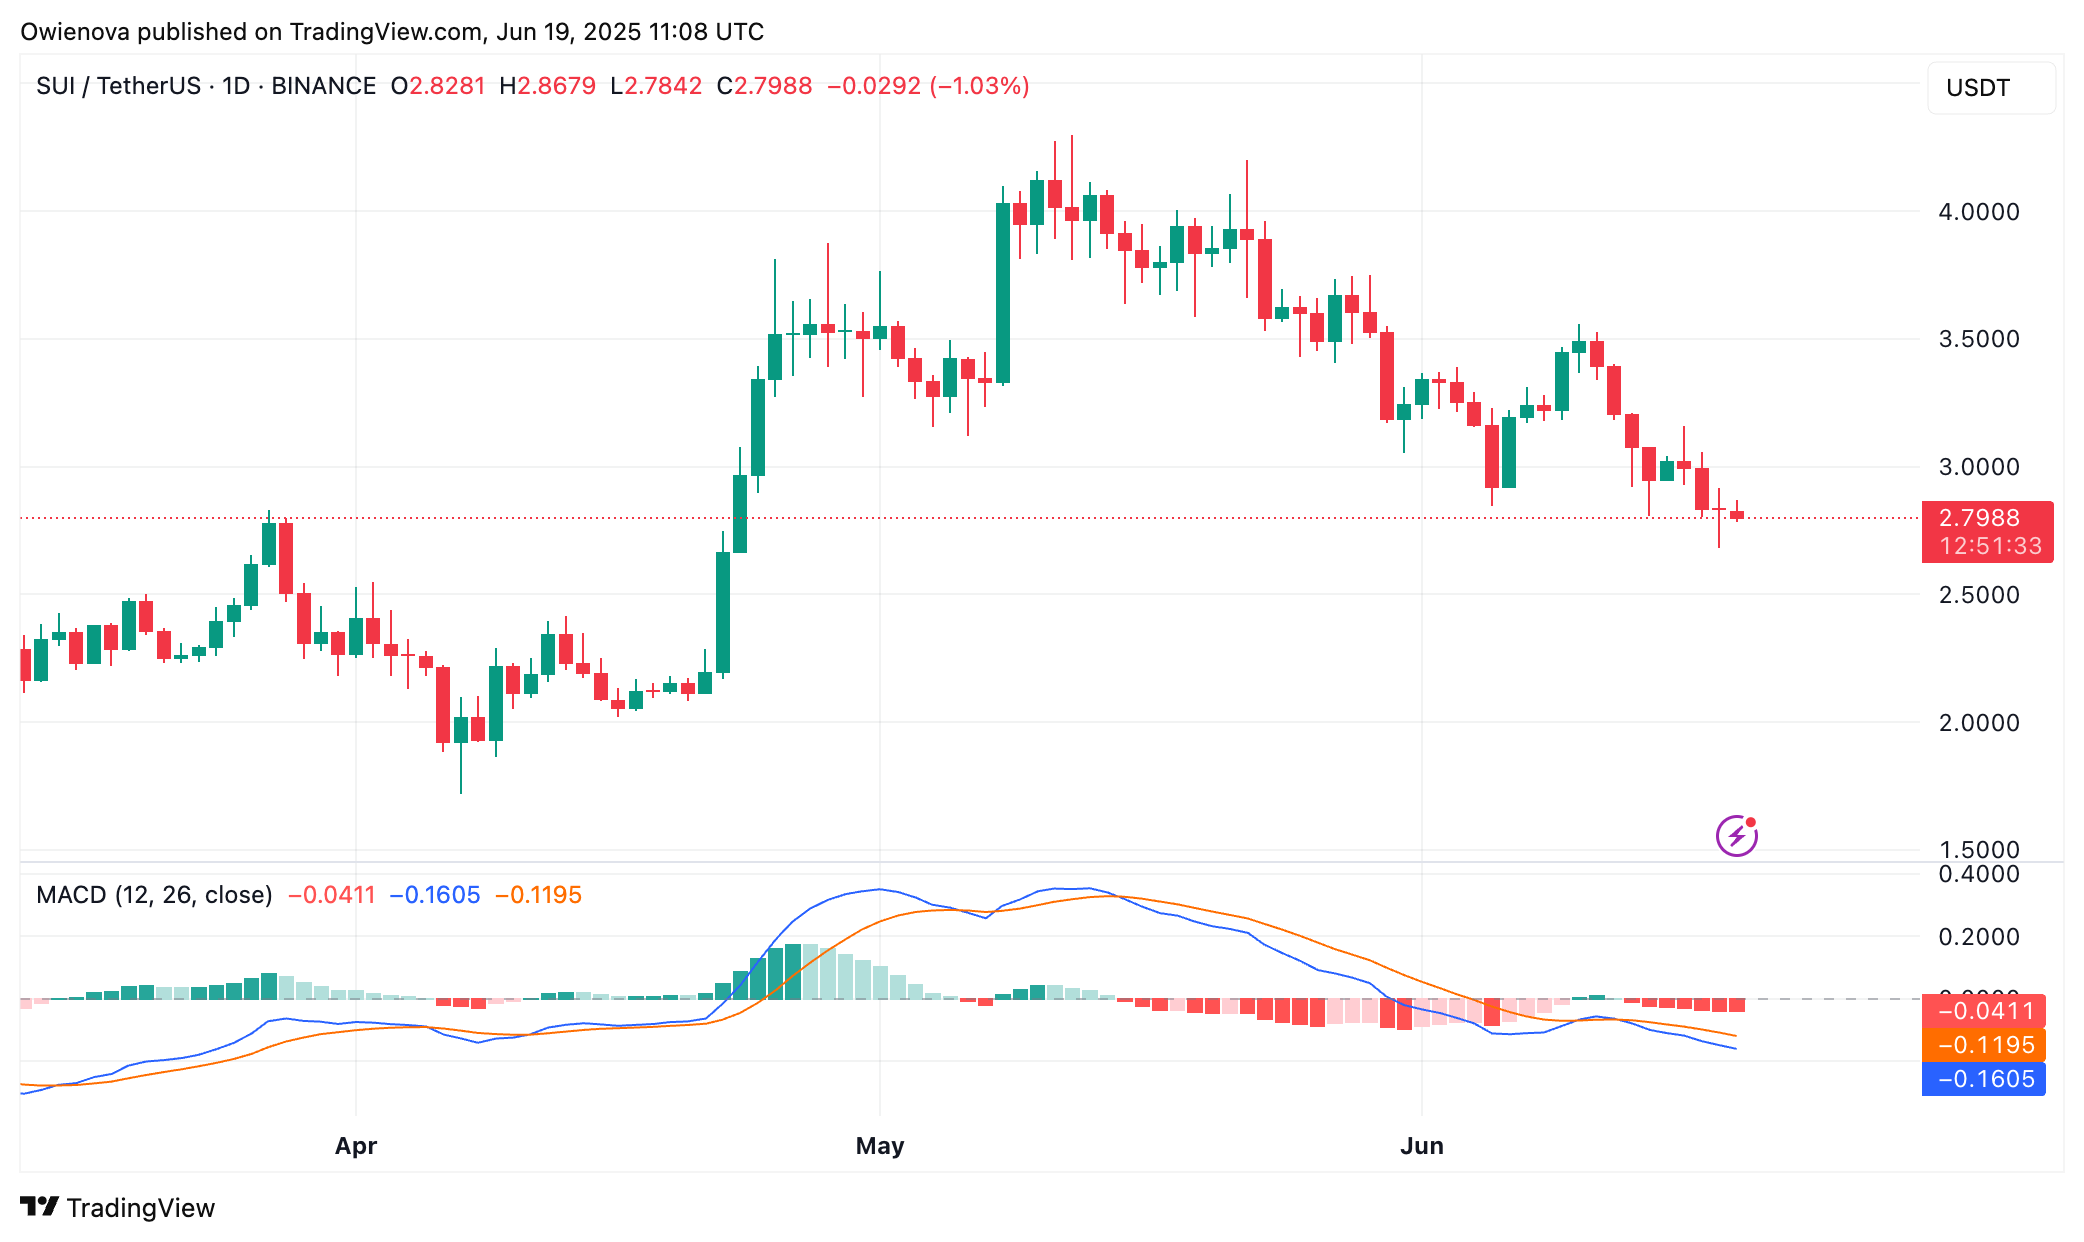
To achieve further gains, SUI must establish higher lows and higher highs. Failure to do so may lead to renewed selling pressure. If the bullish structure falters, a retracement towards $1.57, the ideal accumulation point, is likely.
The current sentiment indicator shows fear, suggesting that a drop to $1.57 could result in extreme fear conditions, presenting optimal dollar-cost averaging opportunities for holders.