SUI Price Surges Over 10% to $4.23 Amid Overbought Signals
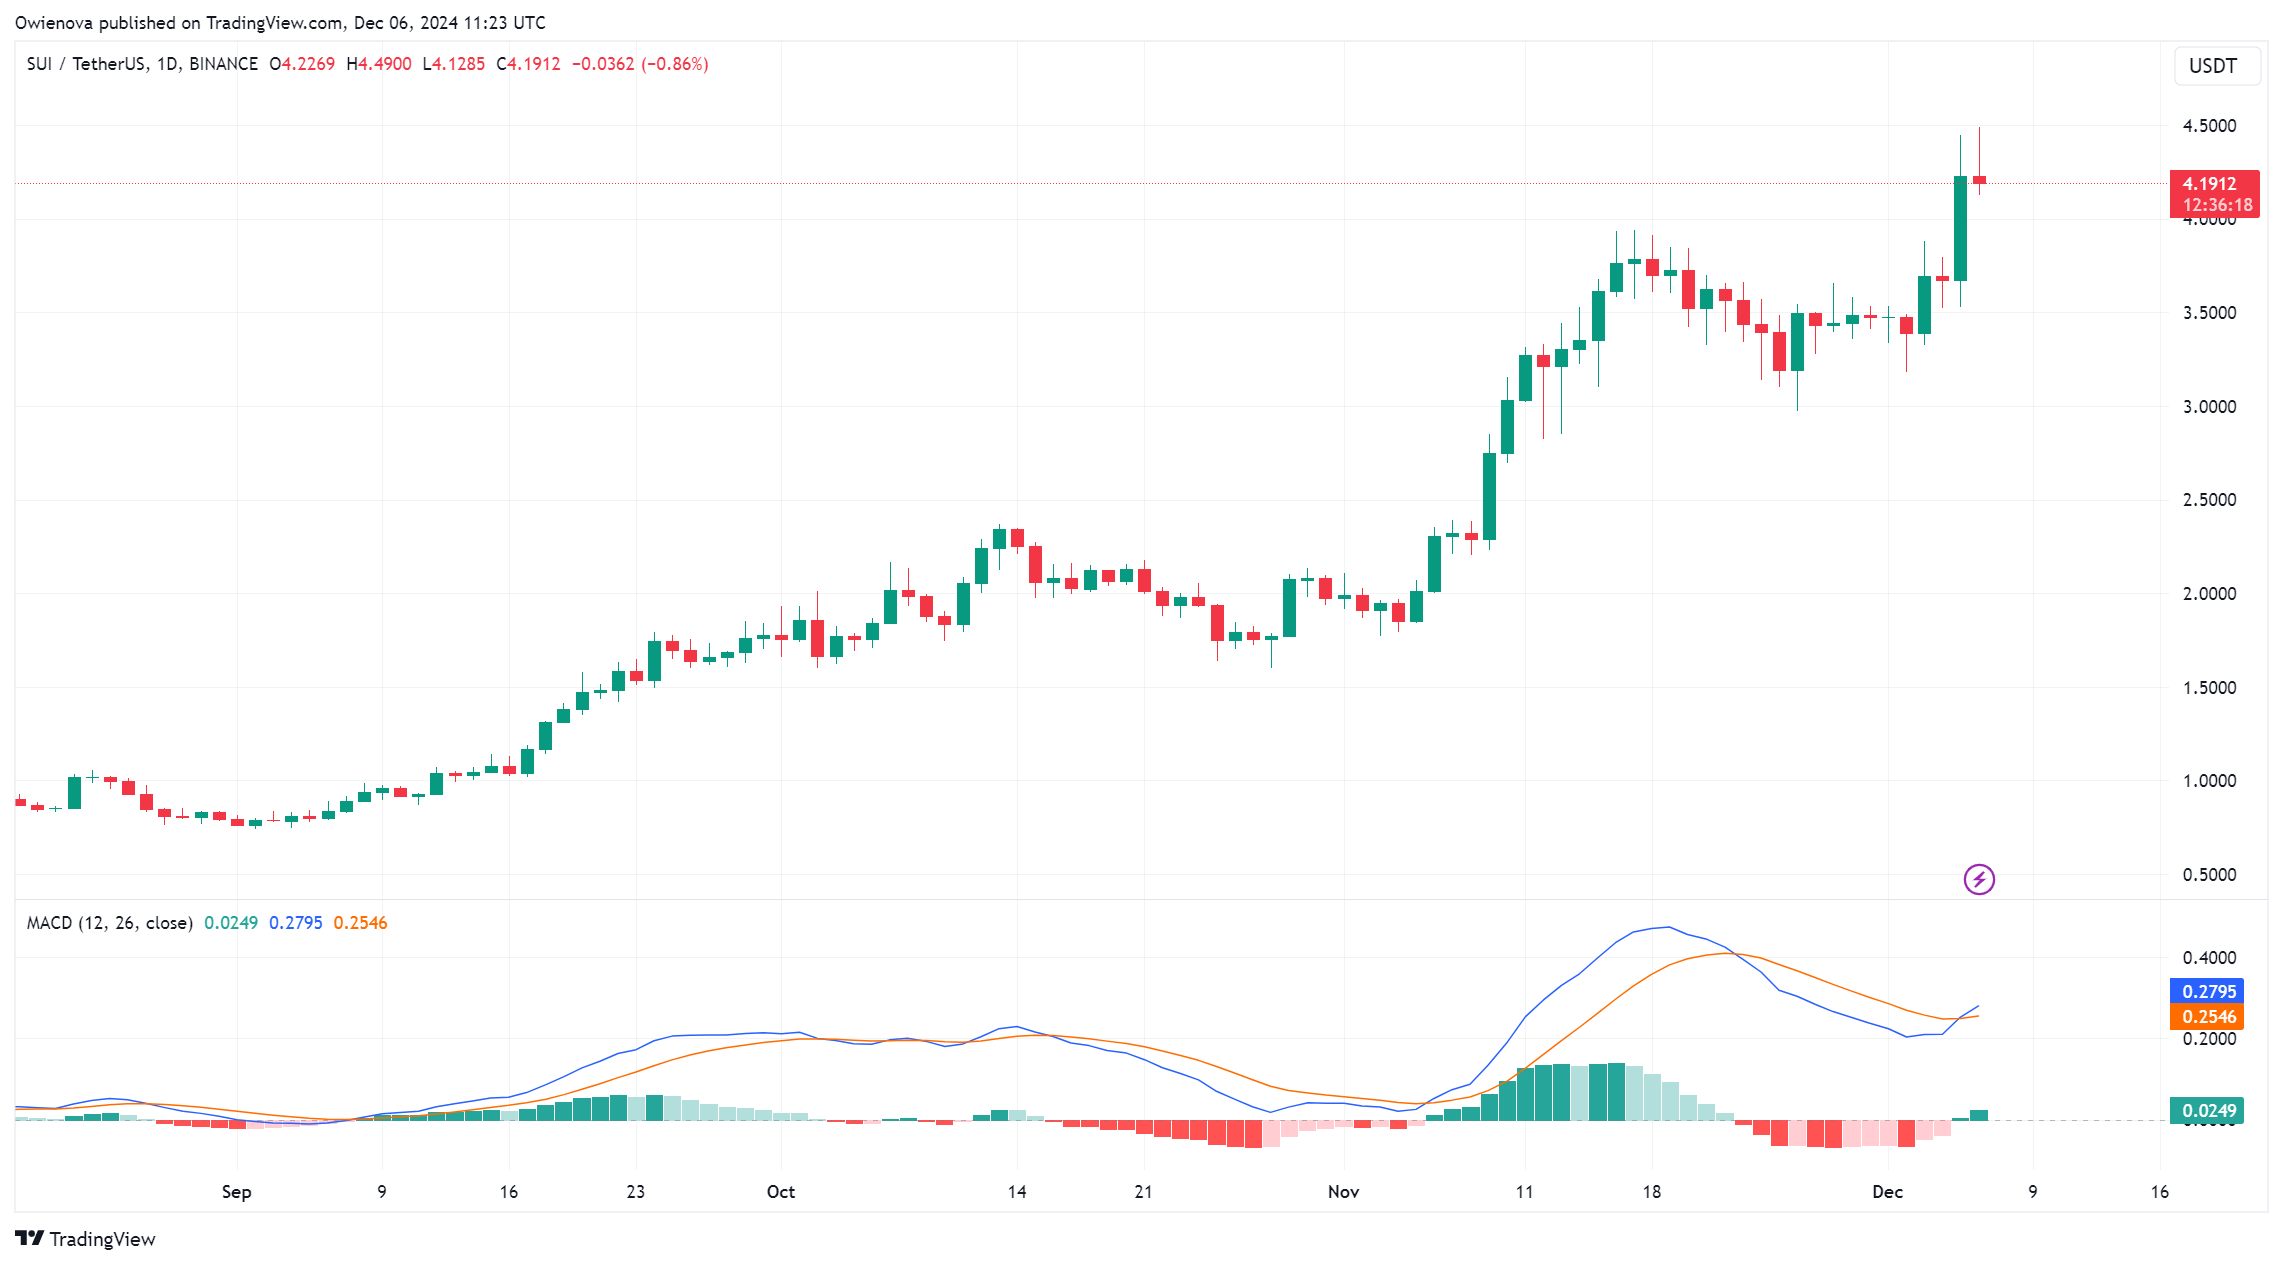
SUI has experienced a significant increase, but signs of potential exhaustion are emerging. Technical indicators suggest the cryptocurrency may be overbought, raising speculation about a possible pullback. Recent bullish momentum has led to questions regarding SUI's ability to sustain its upward trend or face a price correction.
Currently, SUI's price has risen over 10% to $4.23 in the past 24 hours, boosting its market capitalization above $12 billion and trading volume exceeding $5.5 billion, reflecting strong investor interest and market activity.
Technical Analysis: Indicators Hint At Overbought Conditions
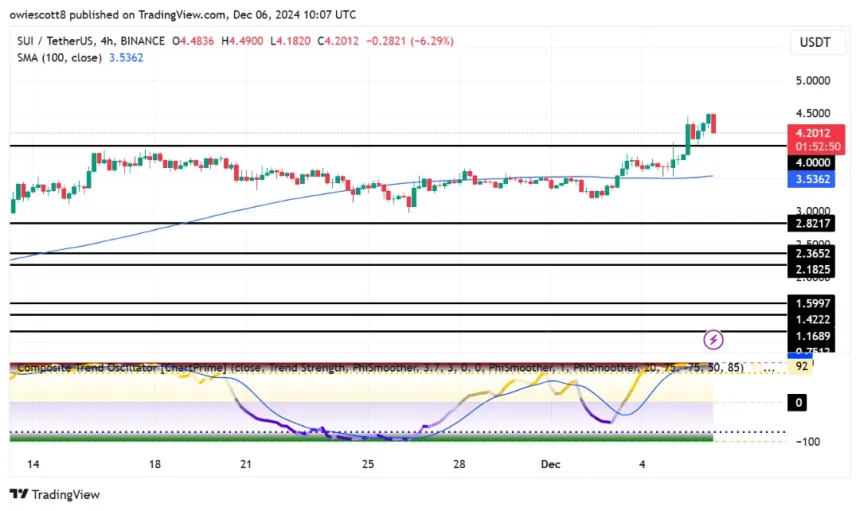
The 4-hour chart for SUI shows bearish signals, with a decline toward the $4 support level and the 100-day Simple Moving Average (SMA). This downward trend is accompanied by a bearish candlestick formation, indicating increased selling pressure. A sustained drop below these levels could indicate a broader trend reversal.

The 4-hour Composite Trend Oscillator also indicates an overbought condition. Such readings typically suggest rapid price increases that may lead to market exhaustion as buying strength diminishes, serving as a cautionary signal for traders about a potential price correction or consolidation phase.
Key Support Levels To Watch If A Pullback Occurs
In the event of a pullback, key support levels warrant monitoring. The $4 mark is significant, aligning with the 100-day SMA. A drop below this support could lead to further declines, with additional support zones near $3.75 and $3.50 acting as potential cushions. These levels are critical in determining whether any pullback will be brief or develop into a more extended bearish phase.
If buyers manage to maintain control at the $4 support level, it could initiate a renewed rally for SUI towards $4.50 and beyond.
