Jun 11, 2025
1 0
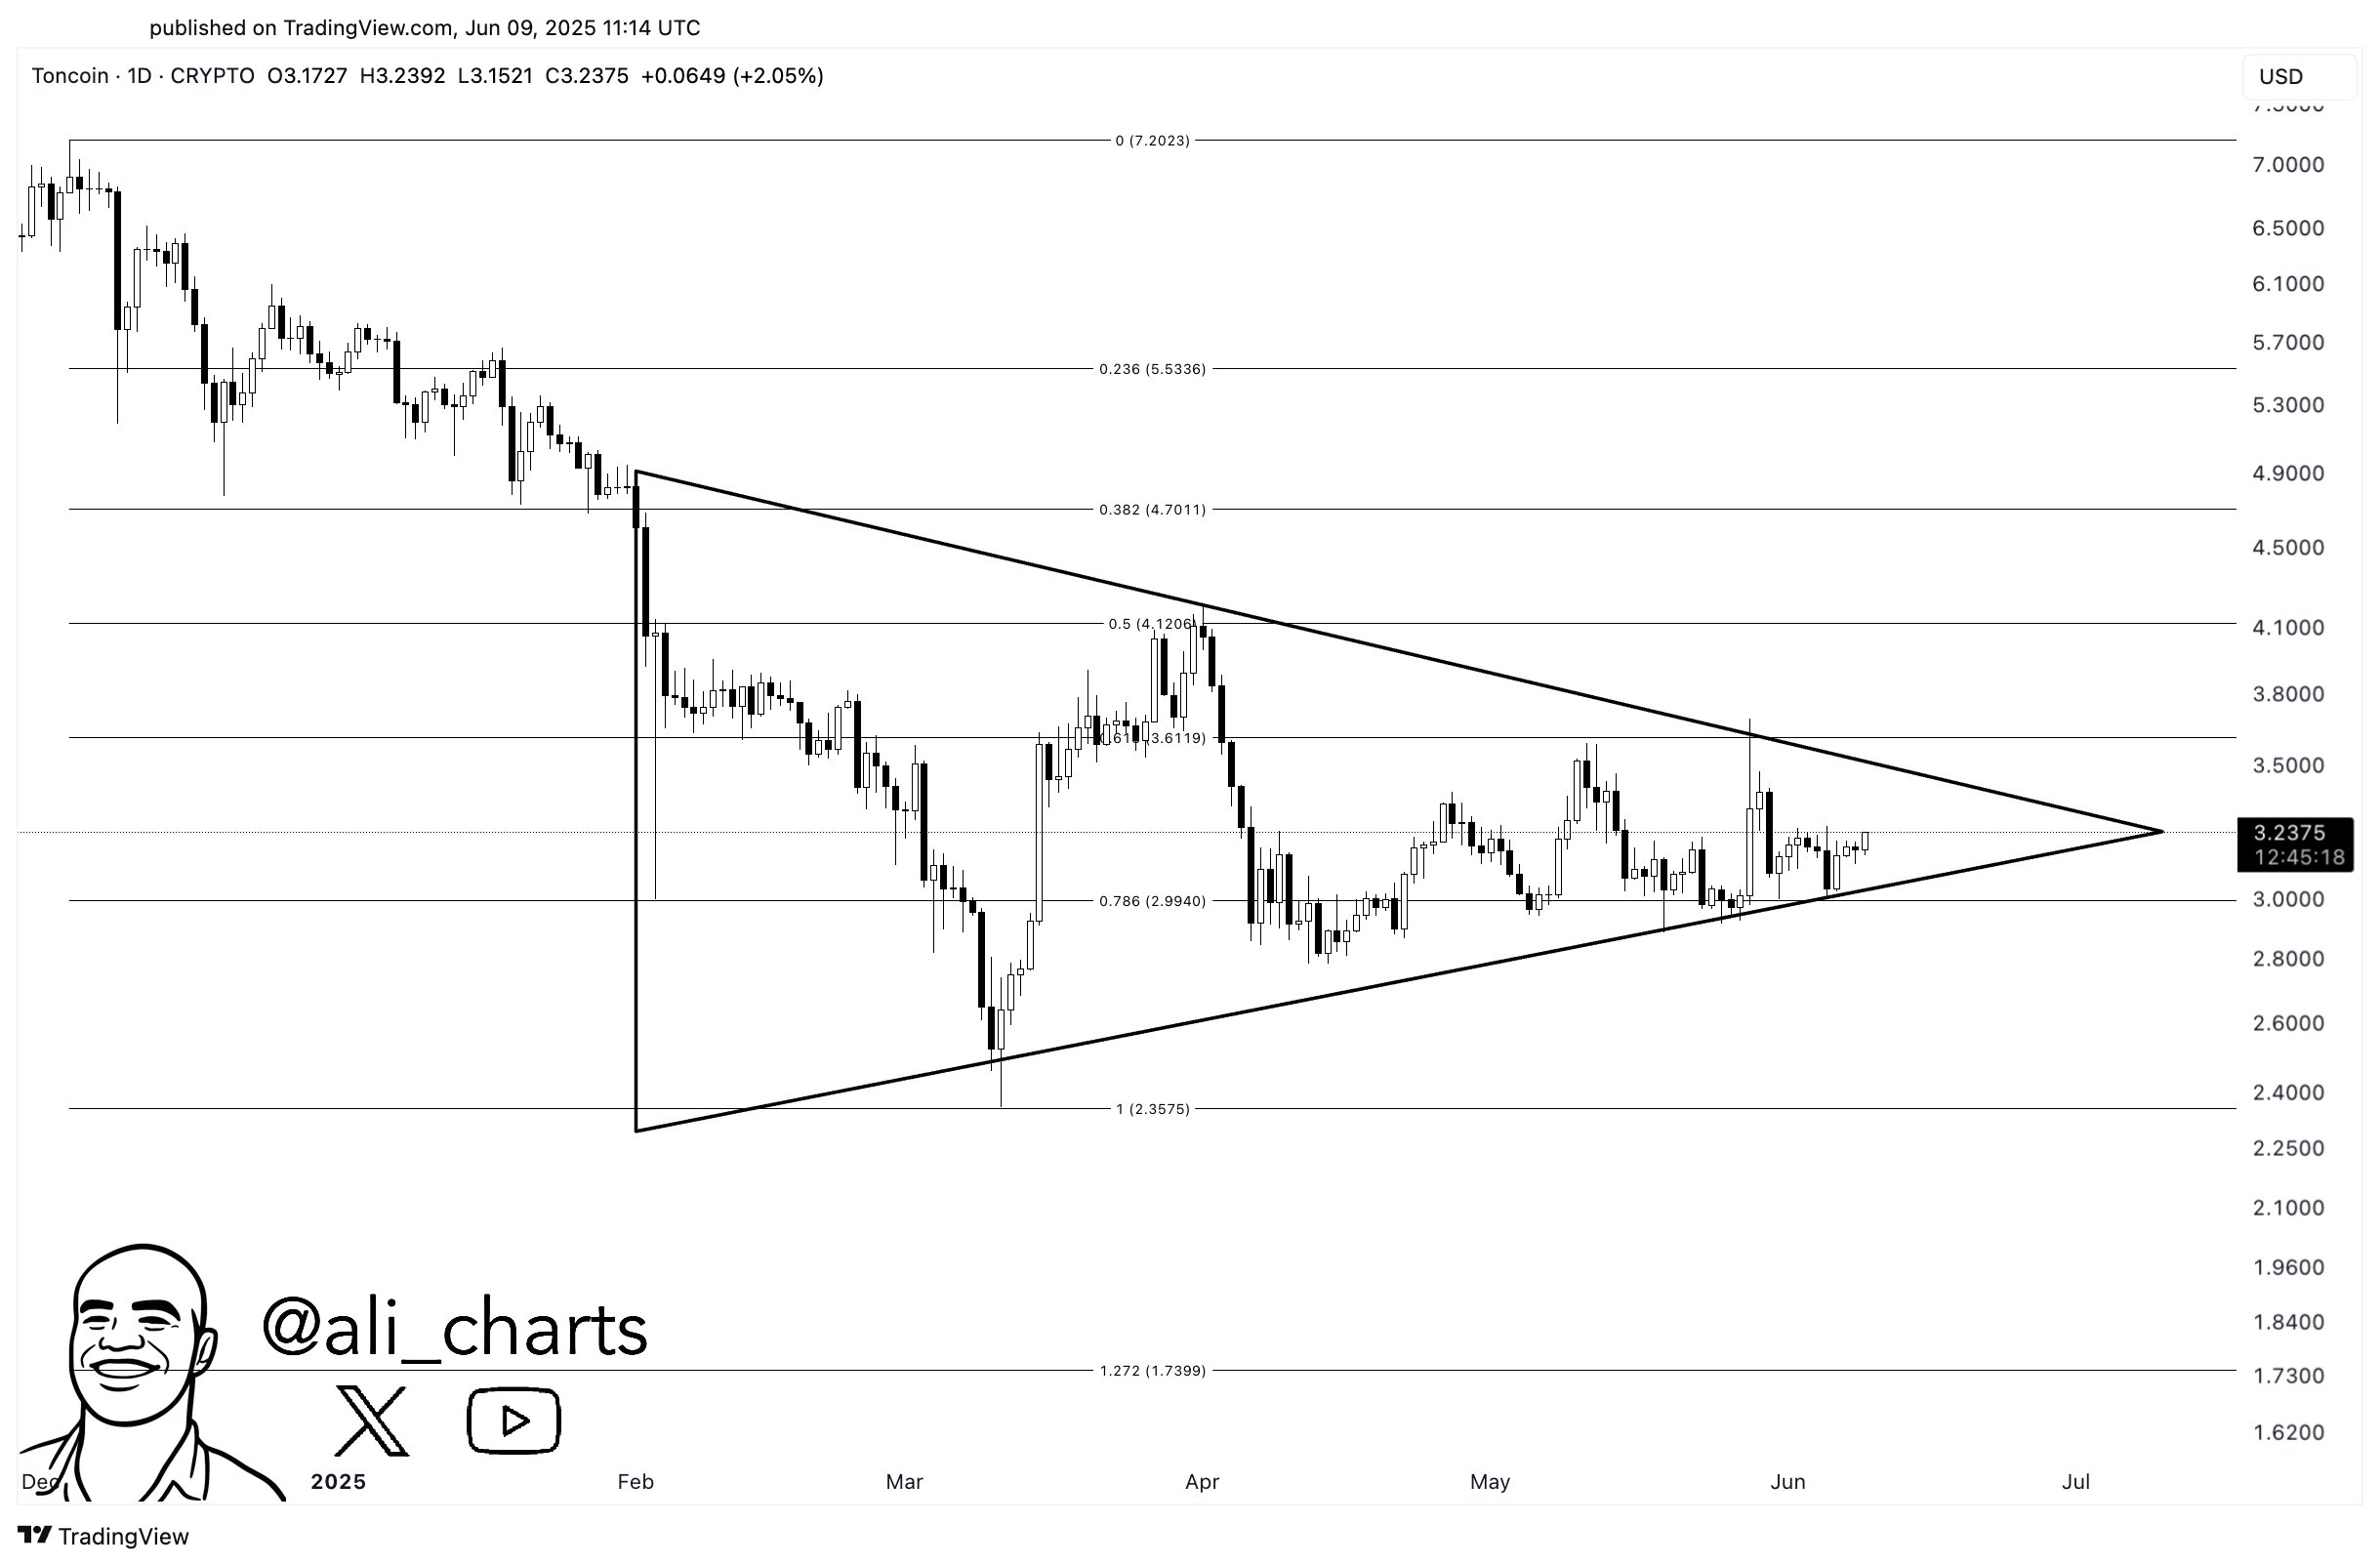
Toncoin Trading in Triangle Pattern with Potential 40% Breakout
An analyst highlights that Toncoin (TON) is currently forming a Triangle pattern, which could lead to a 40% price movement.
Key Points
- Toncoin is trading within a Triangle pattern on the daily timeframe.
- The upper trendline may serve as resistance while the lower line acts as support.
- A breakout from either trendline can indicate a continuation of the current trend.
- Types of Triangles include Ascending, Descending, and Symmetrical, with variations affecting breakout probabilities.
- Current analysis suggests a slight bias towards a downward breakout due to the Triangle's shape.
- Recent price action shows support at the lower line, with Toncoin nearing the apex of the pattern.
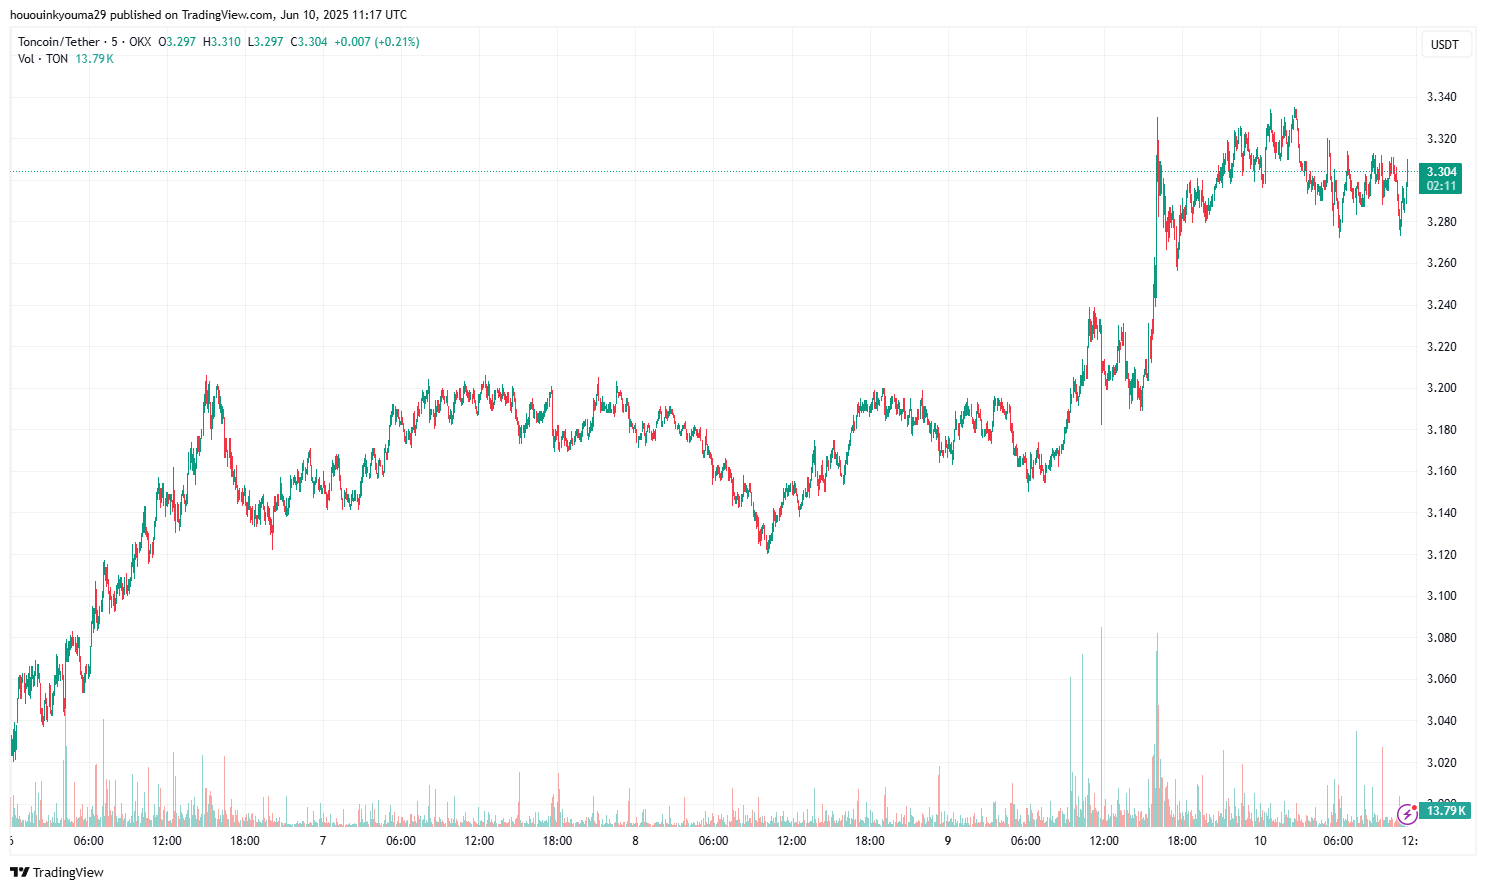
- As of now, Toncoin is trading at approximately $3.3, reflecting a 2% increase over the past week.