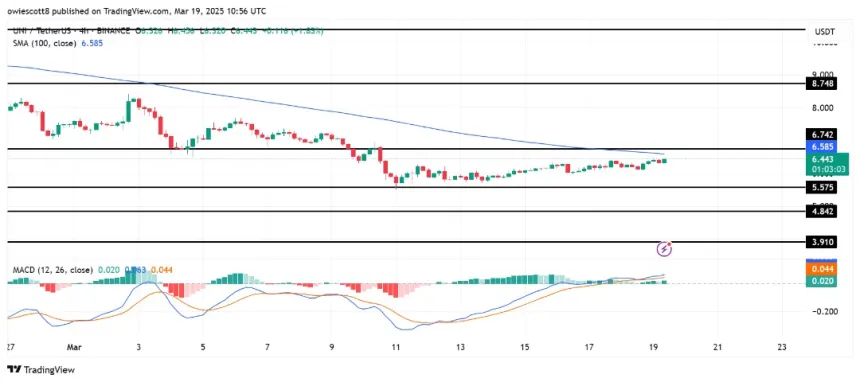
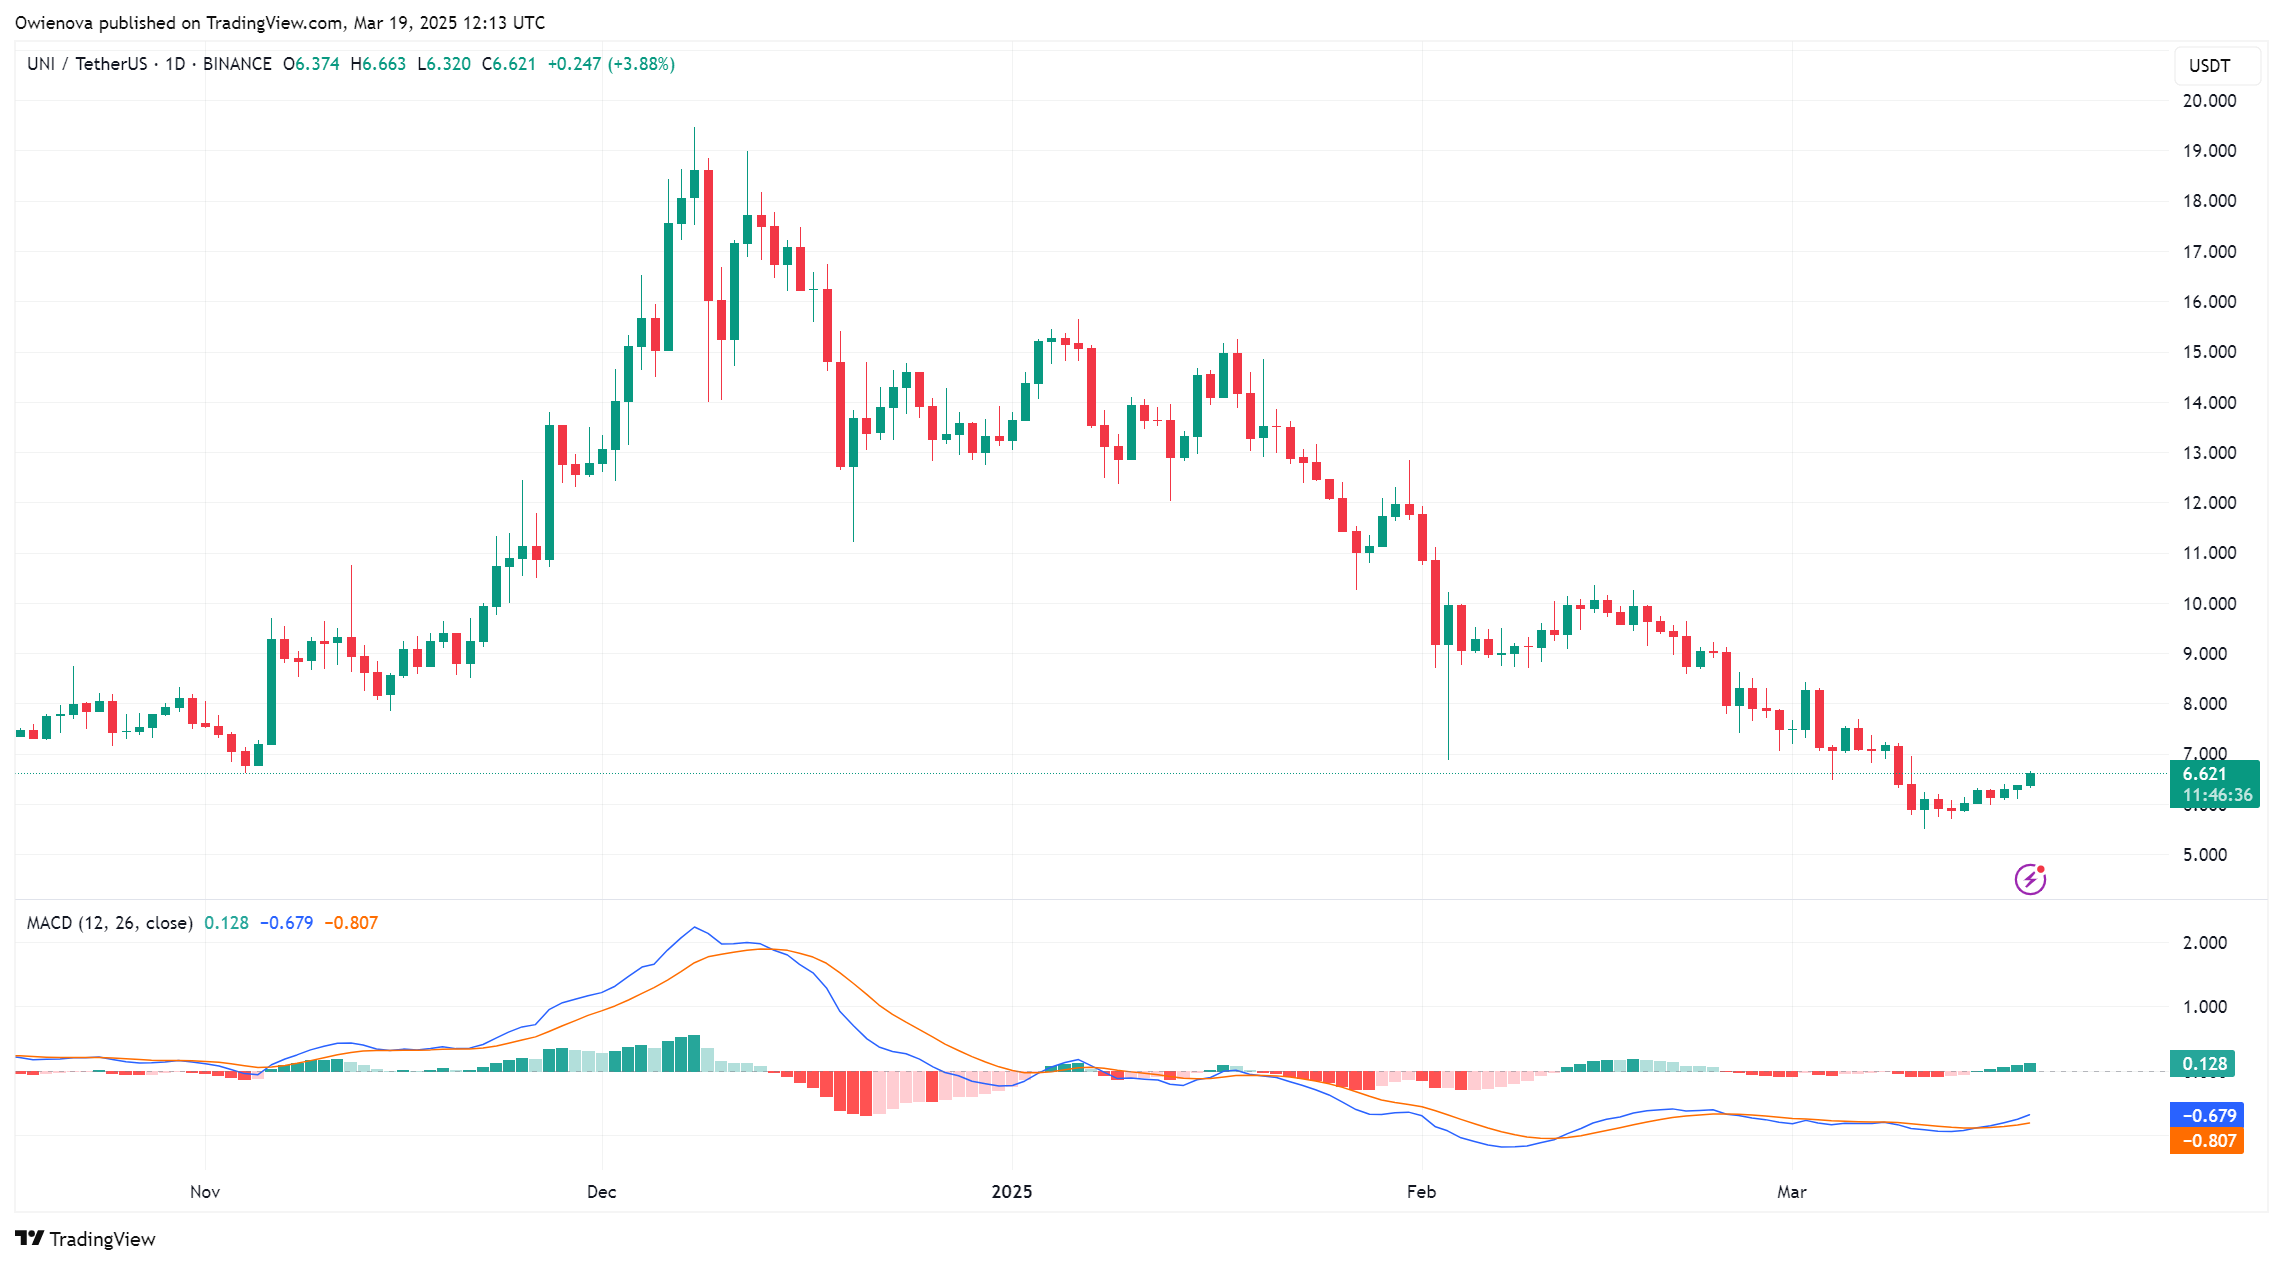
Uniswap Approaches 100-Day Moving Average Amid Price Volatility
Uniswap (UNI) is nearing the 100-day Simple Moving Average, a key technical threshold that may determine its price direction. A breakout above this level could initiate a bullish rally, while a rejection might result in downward pressure.
Current Price Action
- Uniswap's price is increasing and approaching the critical moving average.
- The MACD indicator signals bullish momentum, having crossed above the signal line.
- Increased trading volume indicates rising interest from both buyers and sellers.
- A push above the moving average could strengthen positive sentiment.
- A rejection at this level may lead to selling pressure and a potential retracement.
Bullish vs. Bearish Scenarios
- A successful move above the 100-day SMA with strong volume could reignite bullish momentum, targeting $6.7 resistance.
- A surge past $6.7 might pave the way for a sustained uptrend toward $8.7.
- If UNI fails to maintain position above the moving average, bearish pressure may increase, potentially dropping prices to $5.5.
- A failure to hold this support could trigger a deeper retracement and loss of momentum.