WIF Drops Below $3.582 Support, Raising Concerns of Further Declines
The recent dip of WIF below the critical $3.582 support level has raised market concerns, as bearish sentiment strengthens. This breach could lead to further losses, prompting traders to assess whether a bullish recovery is possible or if declines will persist.
Analysis of WIF’s Price Movement
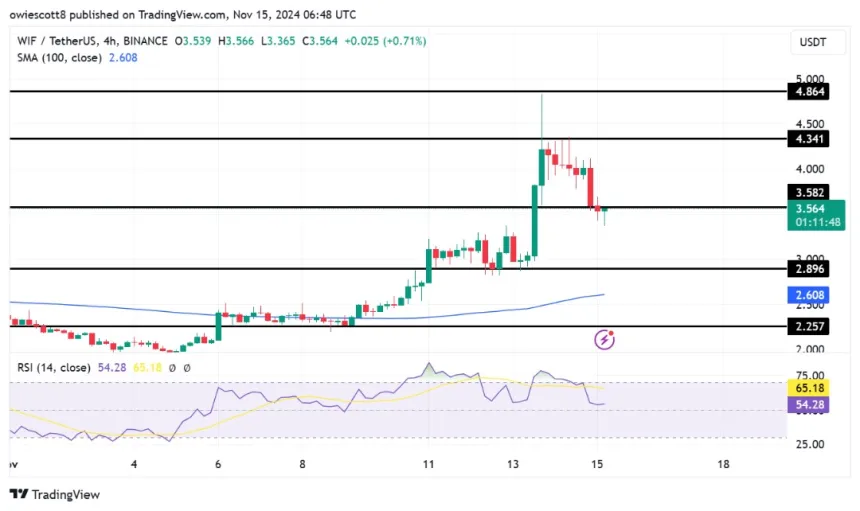
WIF's break below $3.582 on the 4-hour chart signals bearish momentum, with prices moving towards the $2.896 support range and the 100-day Simple Moving Average (SMA). The market is observing for signs of stabilization or deeper declines.

The 4-hour Relative Strength Index (RSI) has decreased from overbought levels to 53%, indicating reduced upward momentum and waning buying pressure. Market participants await indications of continued decline or potential shifts in momentum.
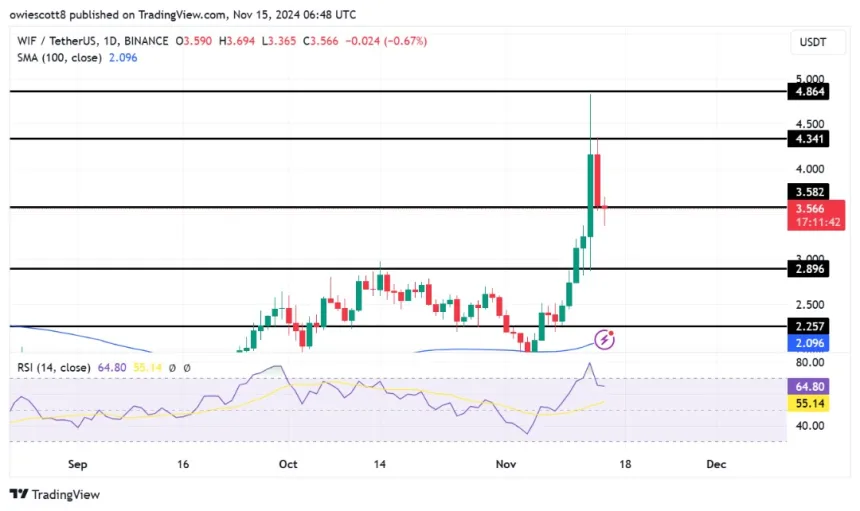
On the daily chart, WIF exhibits strong negative strength, characterized by a bearish candlestick pattern pushing prices below the $3.582 support. This suggests sellers dominate the market, increasing the likelihood of further price drops.

The 1-day RSI analysis shows WIF may experience extended losses, having fallen from 80% to 64%, reflecting decreased buying pressure. This trend typically indicates potential weakness in bullish momentum, suggesting more downward pressure if the RSI continues to decline.
Key Support Zones for WIF
If WIF continues its downward trajectory, key support zones include the $2.896 level, previously significant for price stabilization. The next monitoring point is around $2.257, where additional buying interest may emerge. A breach below these levels could lead to further declines toward psychological support zones.
Conversely, should WIF break below the $2.896 support level, it may indicate the onset of a bullish comeback, potentially driving prices back above the $3.582 level and toward higher resistance points.
