Dec 18, 2025
7 2
XRP Enters Historical Window That Has Previously Led To Triple-Digit Rallies
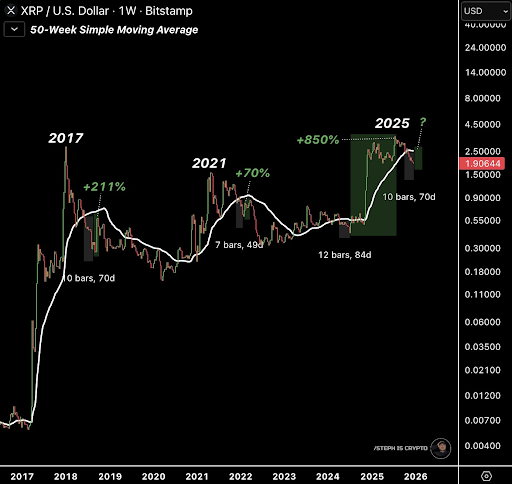
- XRP's weekly chart has entered a critical technical zone, often acting as a turning point in recent years. The focus is on the 50-week simple moving average (SMA), a long-term trend indicator.
- Analysis shows that periods below the 50-week SMA have historically marked the end of downturns and the start of rallies for XRP.
- The 50-week SMA acts as a structural divider between bearish and bullish phases. Brief dips are less significant than extended periods below this level.
- In past cycles, XRP spent around 70 days below the 50-week SMA before an upward move. In 2017, it took about 70 days, resulting in a sharp upside. In 2021, the duration was 49 days, leading to significant price increases.
- The most notable rebound occurred in 2024, with XRP trading below the 50-week SMA for 84 days before experiencing a +850% increase.
- Currently, XRP is nearing 70 days below the 50-week SMA, indicating potential for a similar pattern as seen in previous cycles.
- Historically, XRP rallies ranged from 70% in 2021 to 850% in 2024 after breaking above the 50-week SMA.