Feb 26, 2026
4 0
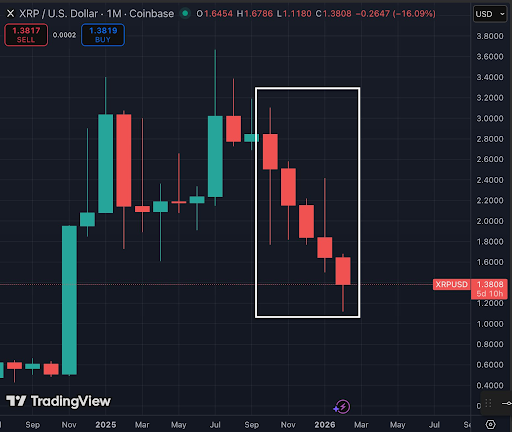
BEARISH 📉 : XRP approaches rare five-month losing streak on monthly chart
XRP is nearing a rare technical milestone on its monthly chart, currently trading around $1.38. If it closes February below the opening price of $1.64, it will mark five consecutive months of decline, a pattern last seen in early 2017 before a strong bull phase.
Current Market Structure
- The ongoing sequence of red monthly candles stretches from late 2025 to early 2026.
- XRP reached an all-time high of $3.65 in July 2025 and has mostly been in decline since.
- February's close will be crucial in determining if this downtrend continues.
Historical Context
- Previous five-month declines have usually preceded significant upward moves.
- XRP is above a key support zone at $1.20, potentially slowing further sell-offs.
Outlook for March
- Analysts suggest a higher probability of a green month in March based on historical patterns.
- However, the current market structure differs from previous cycles due to a larger market cap, requiring more capital for substantial rallies.
- A steady recovery might involve reclaiming resistance levels at $1.60, $2.00, and $2.50 before targeting $2.80 and $3.00.