Jun 26, 2025
2 0
XRP Indicates Potential Major Price Movement as Chart Patterns Emerge
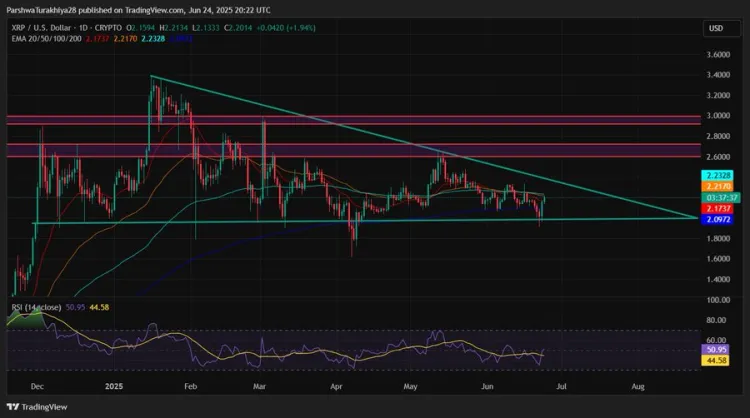
XRP is experiencing a tightening price action following a consolidation phase, indicating a potential upcoming move. Key points include:
- XRP remains within a triangle pattern, suggesting pressure before sharp movements.
- The Exponential Moving Average (EMA) cluster at $2.17 - $2.23 is crucial for upward momentum; a break above may signal a bullish reversal.
- A support level at $2.09 is critical for bulls; failure could lead to a drop to $1.85.
- The Relative Strength Index (RSI) shows neutral conditions, hinting at impending volatility.
- Dr. Profit predicts a mid-term target of $4.00, noting a bullish structure forming on the weekly chart.
- Resistance levels towards a $3.00 target are identified: $2.22 (easy), $2.33 (harder), $2.48 (moderate), and $2.65 (challenging).
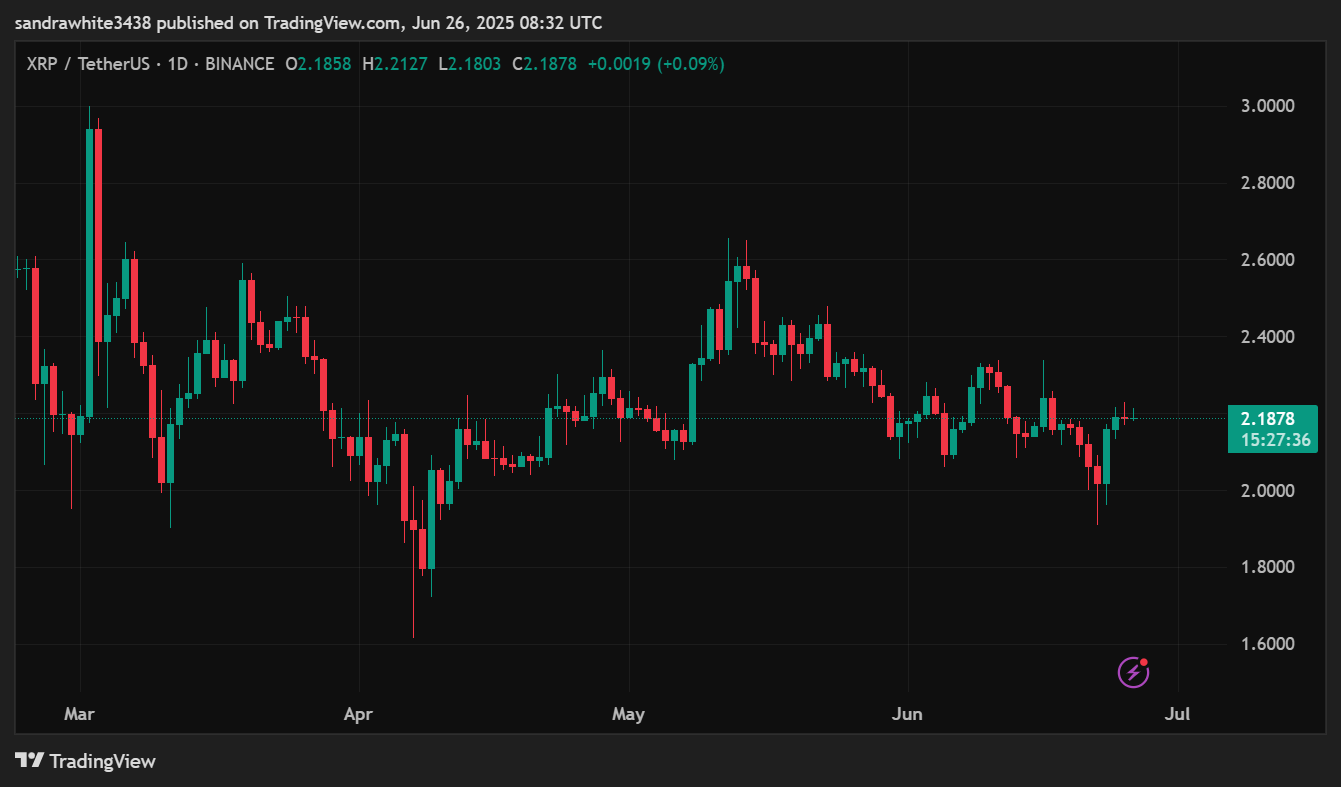
- A bounce off the $2.00 support strengthens the bullish setup with potential rapid movement toward $3.50.