XRP Price Attempts Break Above $2.350 Resistance Level
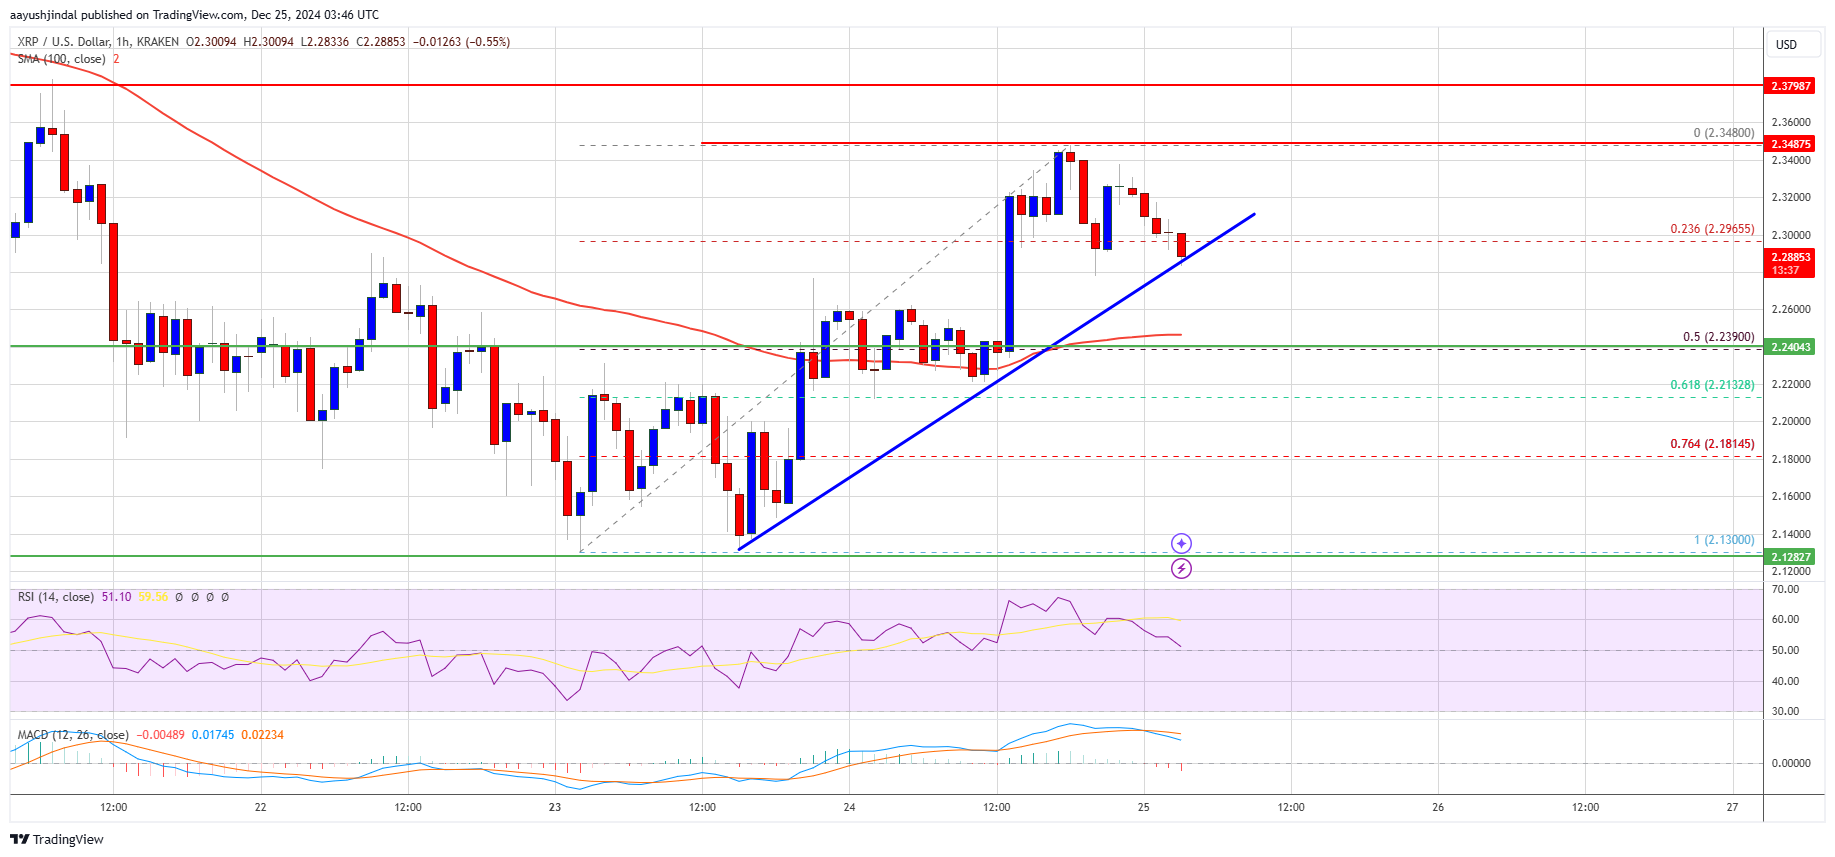
XRP price has recovered some losses, trading above the $2.25 level but facing resistance at $2.350.
- XRP is attempting to rise above the $2.250 resistance zone.
- The price is above $2.25 and the 100-hourly Simple Moving Average.
- A bullish trend line is forming with support at $2.285 on the hourly chart of the XRP/USD pair (data source from Kraken).
- A significant increase may occur if the price clears the $2.350 resistance.
XRP Price Faces Hurdles
XRP began increasing above the $2.20 support level, similar to Bitcoin and Ethereum. It moved past the $2.25 and $2.30 levels.
The price tested $2.35 before encountering selling pressure, reaching a high of $2.348 and now consolidating gains. A minor decline occurred below the 23.6% Fibonacci retracement level from the $2.130 swing low to the $2.348 high.
Currently, XRP trades above $2.25 and the 100-hourly Simple Moving Average, with a bullish trend line at $2.285.
Potential resistance exists near $2.32, with primary resistance at $2.35. If cleared, the next resistance is $2.40, potentially leading to $2.50.
Further gains could push the price towards $2.550 or $2.650, with a major hurdle at $2.720.
Another Decline?
If XRP cannot surpass the $2.350 resistance, it may face another decline. Initial support is near $2.28 and the trend line, with major support at $2.240 or the 50% Fibonacci retracement level from the upward move.
A downside break and close below $2.240 could lead to a decline towards the $2.20 support, with further support around $2.050.
Technical Indicators
Hourly MACD – The MACD for XRP/USD is losing momentum in the bearish zone.
Hourly RSI (Relative Strength Index) – The RSI for XRP/USD is above the 50 level.
Major Support Levels – $2.280 and $2.240.
Major Resistance Levels – $2.350 and $2.40.
