XRP Price Consolidates Near $1.400, Faces Resistance at $1.4550
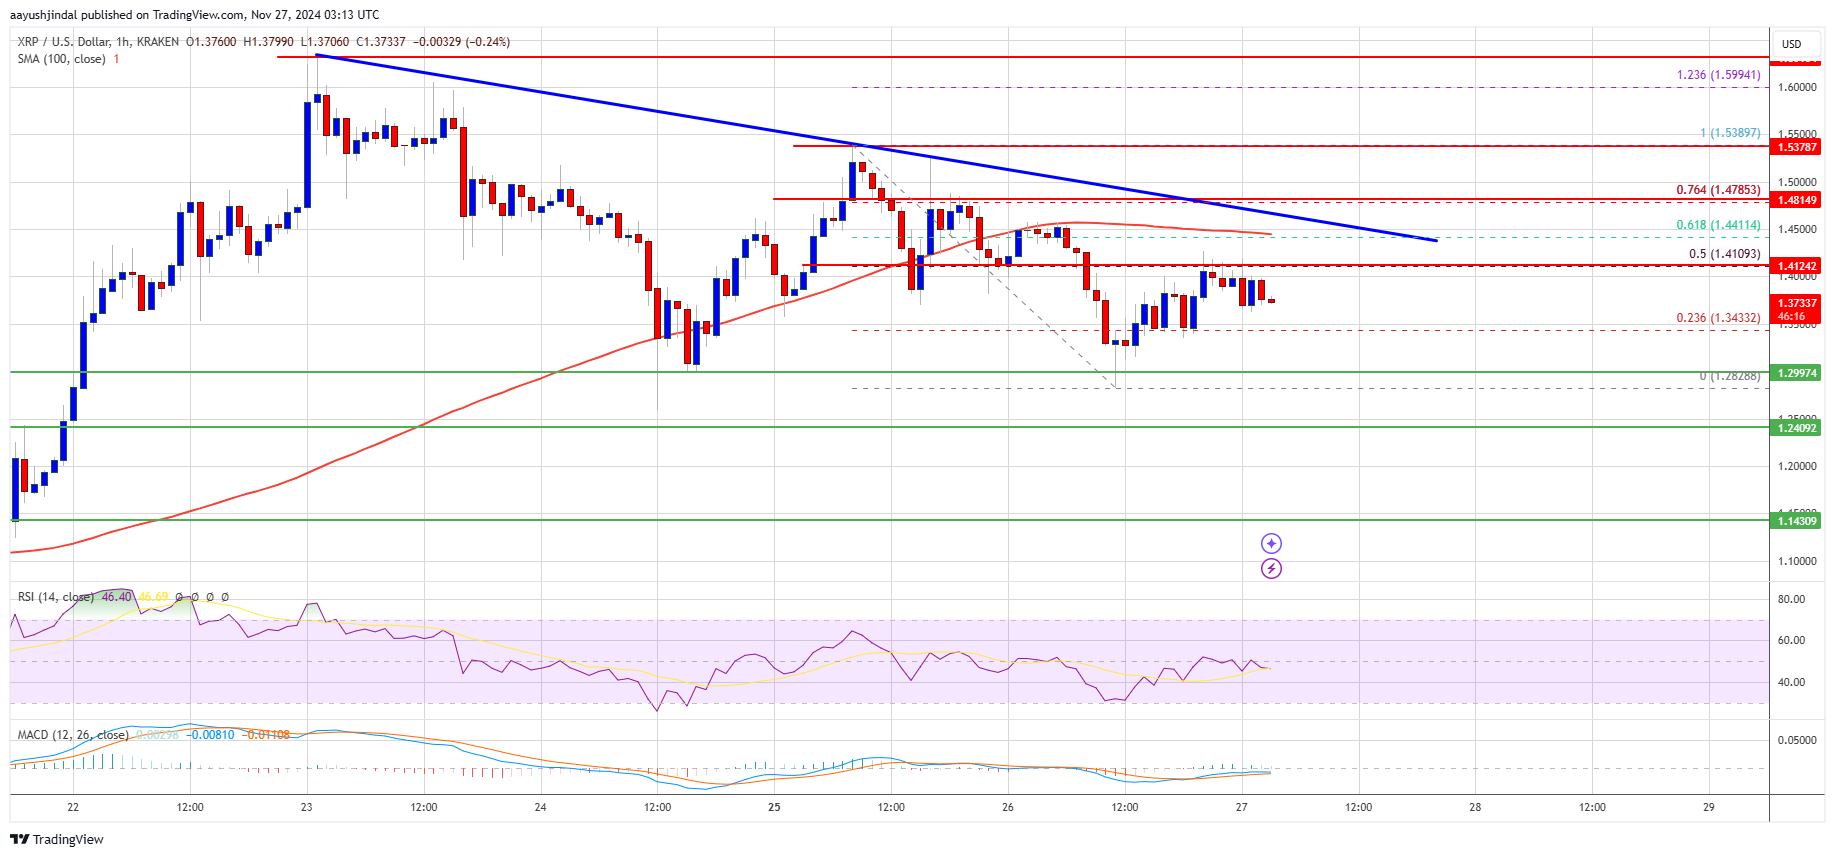
XRP price is consolidating near the $1.400 zone, requiring a clear break above the $1.4550 resistance to initiate a potential increase.
- XRP struggles to surpass the $1.50 level.
- Current trading is below $1.450 and the 100-hourly Simple Moving Average.
- A bearish trend line is forming with resistance at $1.4550 on the hourly XRP/USD chart (data from Kraken).
- A breakout above $1.4550 could enable further upward movement.
XRP Price Stuck Below $1.50
XRP has faced difficulty moving past the $1.50 mark, recently dropping below $1.30, with a low at $1.2828. It is currently recovering, unlike Bitcoin and Ethereum.
The price has surpassed the $1.3250 and $1.340 resistance levels, testing the 50% Fibonacci retracement of the decline from the $1.5389 high to the $1.2828 low. Resistance remains active around $1.420.
Currently, XRP trades below $1.45 and the 100-hourly Simple Moving Average. The primary resistance levels are around $1.450 and the 61.8% Fibonacci retracement of the downward move from the $1.5389 high to the $1.2828 low.
The bearish trend line at $1.4550 presents another resistance point, with $1.50 as a significant next hurdle.
A successful move above $1.50 may target the $1.550 resistance, with further gains potentially reaching $1.600 or $1.620. The bulls face a major challenge at $1.650 or $1.6550.
Another Drop?
If XRP does not break through the $1.4550 resistance, it may enter a downside correction. Initial support is near $1.3200, followed by $1.30.
A close below $1.30 could lead to further declines toward the $1.2800 support, with subsequent support at approximately $1.2650.
Technical Indicators
Hourly MACD – The MACD for XRP/USD shows decreasing momentum in the bullish zone.
Hourly RSI (Relative Strength Index) – The RSI for XRP/USD is below the 50 level.
Major Support Levels – $1.3200 and $1.3000.
Major Resistance Levels – $1.4200 and $1.4550.
