XRP Price Corrects Below $1.120 Amid Bearish Signals
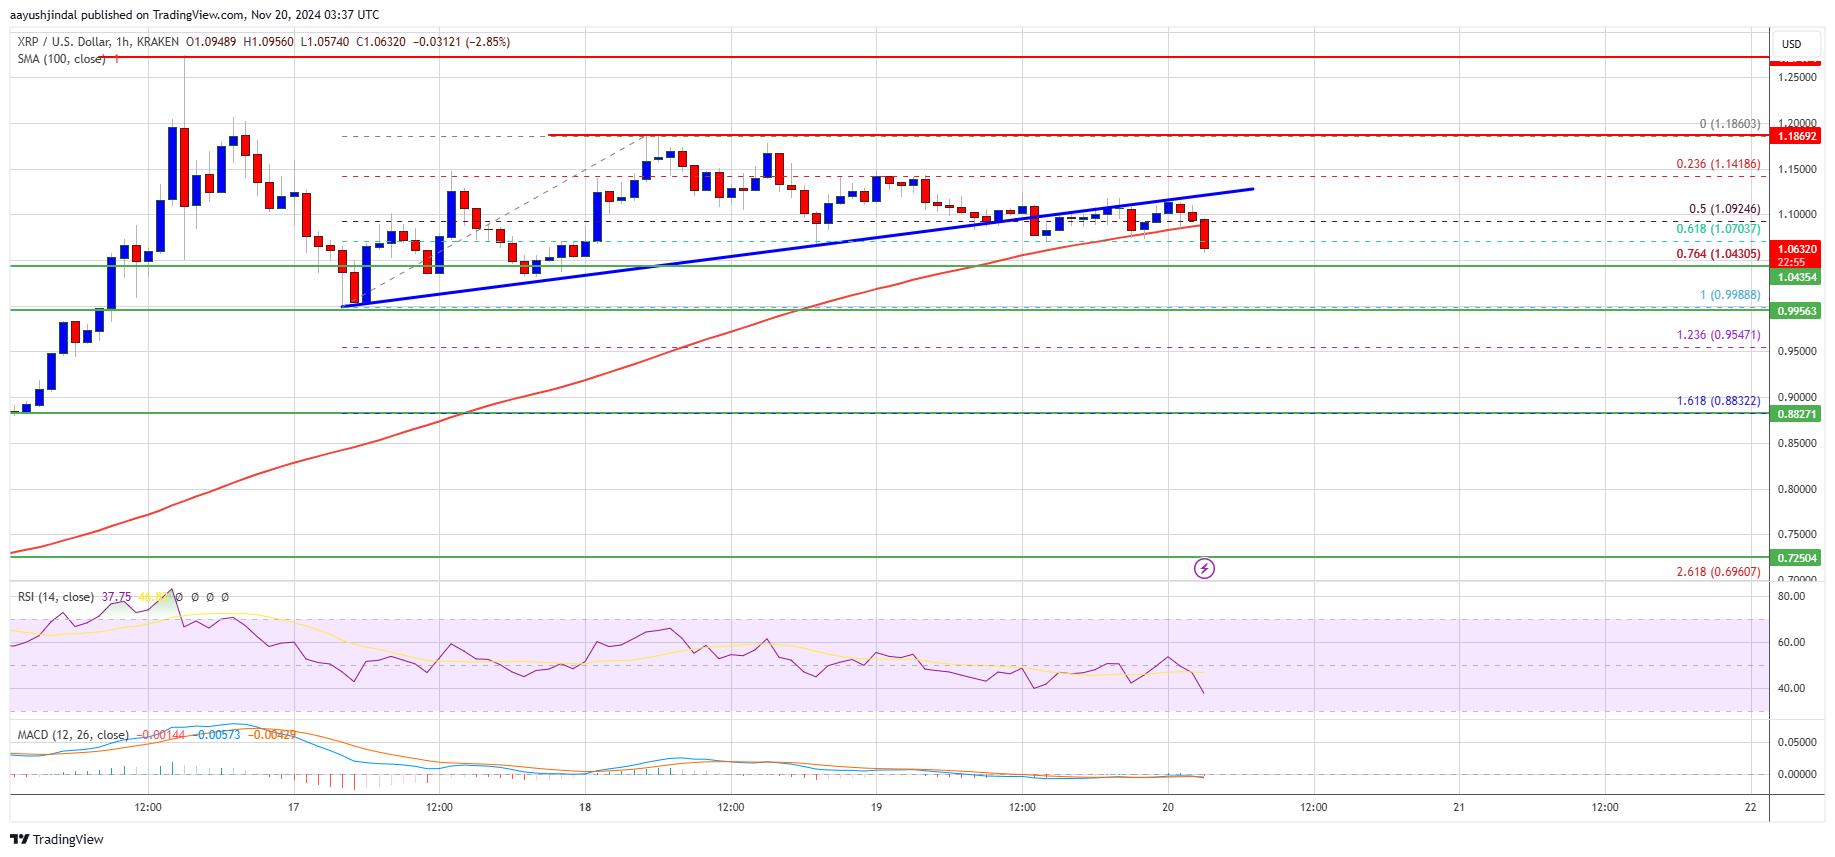
XRP price is correcting gains from the $1.185 resistance zone and may revisit the $1.00 support before potential bullish activity.
- XRP price began a downside correction below the $1.120 level.
- The price is trading below $1.100 and the 100-hourly Simple Moving Average.
- A break occurred below a key bullish trend line with support at $1.110 on the hourly chart of the XRP/USD pair (data source from Kraken).
- The pair could retest the $1.00 support zone before bulls potentially intervene.
XRP Price Dips Again
XRP price struggled to maintain gains above the $1.180 and $1.20 levels, initiating a downside correction and trading below the $1.150 mark. It underperformed Bitcoin and Ethereum in recent sessions.
The price fell below the 50% Fib retracement level of the upward move from the $0.9988 swing low to the $1.1860 high, along with a break below the trend line support at $1.110.
Currently, the price trades below $1.100, approaching the 76.4% Fib retracement level of the prior upward movement.
Resistance is anticipated near the $1.100 level, with major resistance at $1.140 and further resistance at $1.1850.
A decisive move above the $1.1850 resistance may push the price toward $1.200, with potential targets at $1.2250 or $1.2320. The next significant hurdle could be $1.250.
More Downsides?
If XRP does not surpass the $1.140 resistance zone, it may continue to decline. Initial support is around the $1.040 level, with major support near the $1.00 level.
A break and close below the $1.00 level could lead to a decline toward the $0.980 support, with additional major support at approximately $0.920.
Technical Indicators:
Hourly MACD: The MACD for XRP/USD is gaining momentum in the bearish zone.
Hourly RSI (Relative Strength Index): The RSI for XRP/USD is currently below the 50 level.
Major Support Levels: $1.1040 and $1.0000.
Major Resistance Levels: $1.1400 and $1.1850.
