XRP Price Declines Over 10%, Approaching Key $2 Support Level
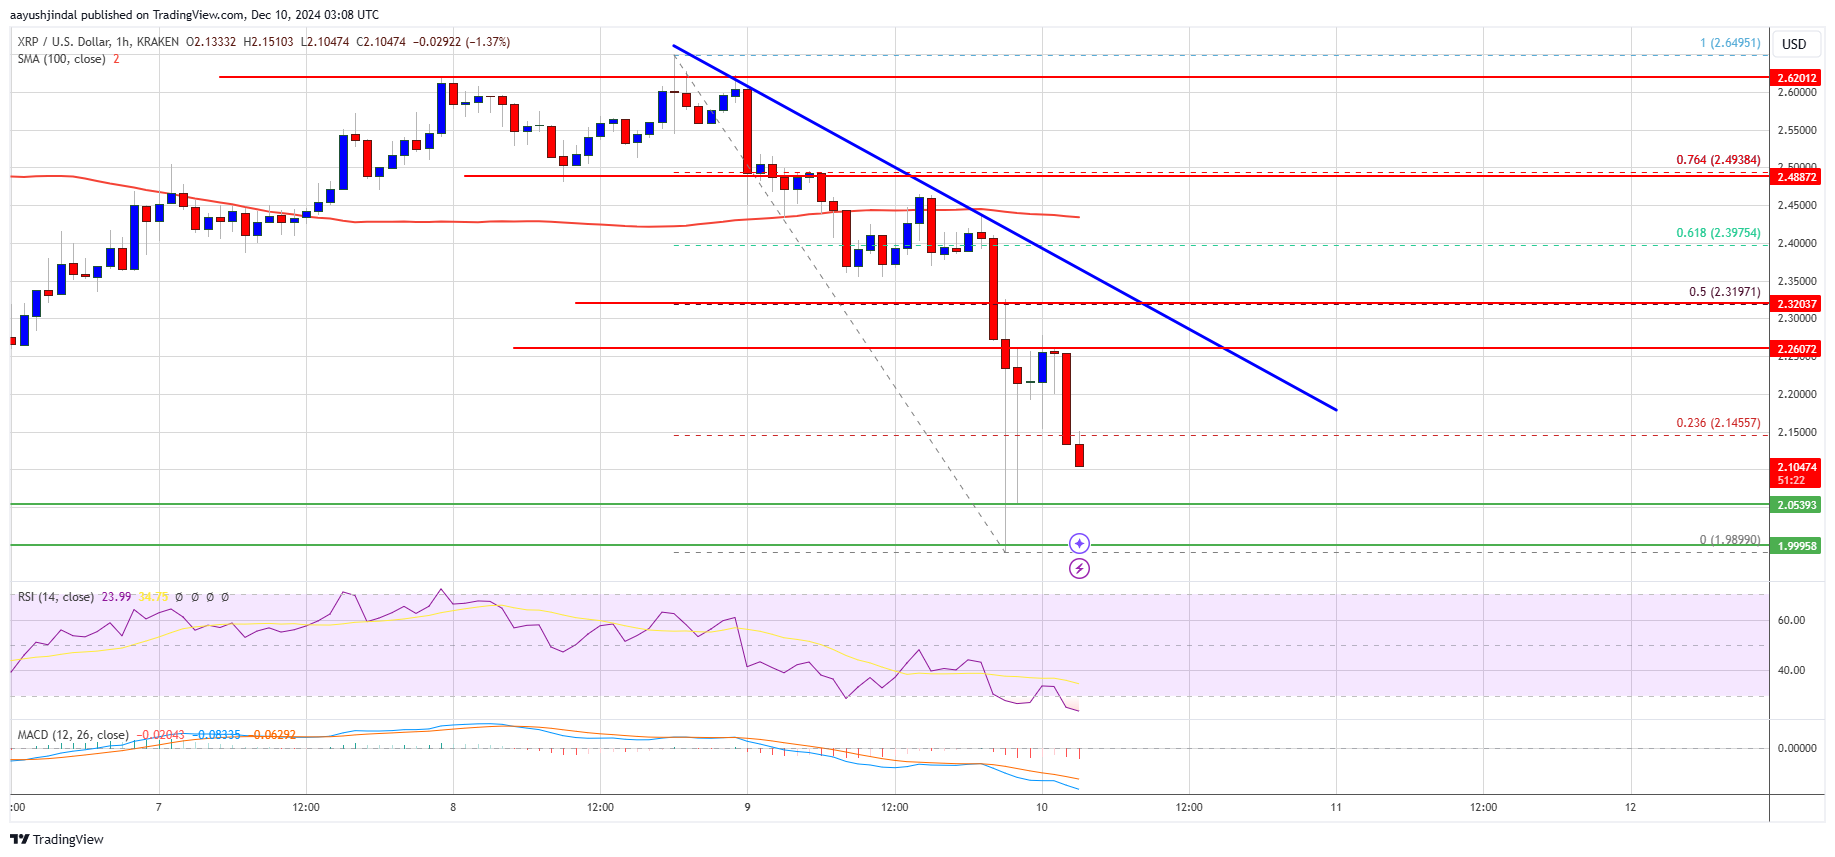
XRP price declined over 10%, falling below the $2.30 level and potentially heading toward the $2.00 support zone.
- XRP initiated a downside correction from the $2.50 resistance zone.
- Current trading is below $2.30 and the 100-hourly Simple Moving Average.
- A bearish trend line forms with resistance at $2.26 on the hourly chart of the XRP/USD pair.
- The price may increase if it surpasses the $2.32 resistance.
XRP Price Dips Again
XRP failed to rise above the $2.50 resistance, leading to a decline below $2.35. The price dropped below $2.30 and $2.25 levels, reaching a low of $1.989 before correcting some losses.
The price has since moved above $2.20, climbing past the 23.6% Fibonacci retracement level from the $2.64 swing high to the $1.98 low. Currently, it trades below $2.30 and the 100-hourly Simple Moving Average, facing resistance near $2.20 and major resistance at $2.250.
A bearish trend line at $2.26 poses additional resistance. The next key resistance is at $2.30, or the 50% Fibonacci retracement level from the same downward move. A breakthrough above $2.30 could lead toward the $2.350 resistance.
Further gains could push the price toward the $2.40 resistance or even $2.420. The next significant hurdle for bullish movements is at $2.550.
More Losses?
If XRP does not break the $2.250 resistance, another decline may occur. Initial support is around the $2.050 level, with major support near $2.00.
A close below the $2.00 level could lead to continued declines toward the $1.880 support, with further support located around $1.750.
Technical Indicators:
Hourly MACD – The MACD for XRP/USD shows increased bearish momentum.
Hourly RSI (Relative Strength Index) – The RSI for XRP/USD is below the 50 level.
Major Support Levels – $2.0500 and $2.0000.
Major Resistance Levels – $2.2500 and $2.3000.
