Nov 14, 2025
9 0
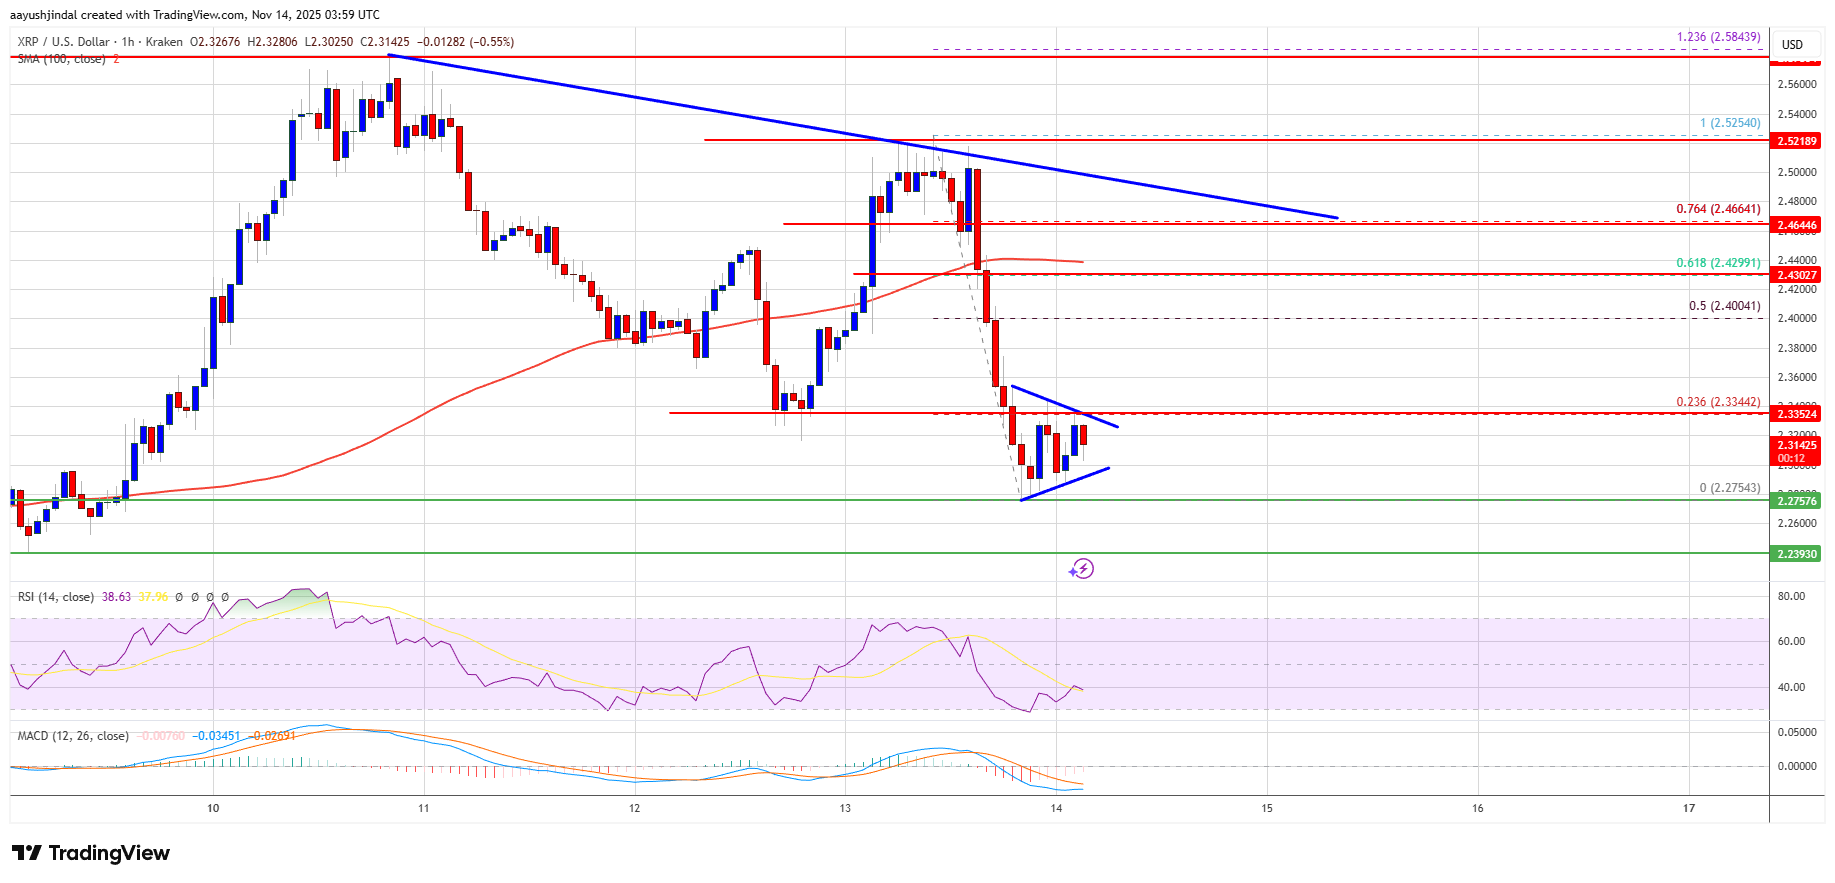
XRP Price Declines Below $2.40 Amid Bearish Market Signs
The XRP price is experiencing a decline, trading below $2.40 and the 100-hourly Simple Moving Average.
- XRP started its descent from $2.550, slipping below the $2.450 zone.
- A short-term contracting triangle with resistance at $2.235 is forming on the XRP/USD hourly chart.
- An attempted rise above $2.50 failed, leading to further decrease below $2.450 and $2.420.
- Price formed a low at $2.2754 and is consolidating below the 23.6% Fibonacci retracement level of the recent drop from $2.525 to $2.2754.
Resistance Levels:
- $2.235 - Short-term resistance.
- $2.40 - First major resistance.
- $2.450 - Critical resistance for potential upward movement.
Support Levels:
- $2.280 - Initial support on the downside.
- $2.250 - Major support level, with risks of further decline if breached.
- $2.20 and $2.120 - Next major supports if downward trend continues.
Technical Indicators:
- The hourly MACD for XRP/USD is gaining pace in the bearish zone.
- The RSI is below the 50 level, indicating potential continued pressure.