XRP Price Declines Below $2.30 Amid Ongoing Resistance Challenges
XRP price declined from the $2.38 zone, consolidating below the $2.30 resistance level.
- XRP struggled to surpass the $2.40 resistance zone.
- The price is trading below $2.30 and the 100-hourly Simple Moving Average.
- A bearish trend line is forming with resistance at $2.25 on the hourly chart for the XRP/USD pair (data source from Kraken).
- If it remains below the $2.30 resistance, the pair may continue to decline.
XRP Price Faces Resistance At $2.40
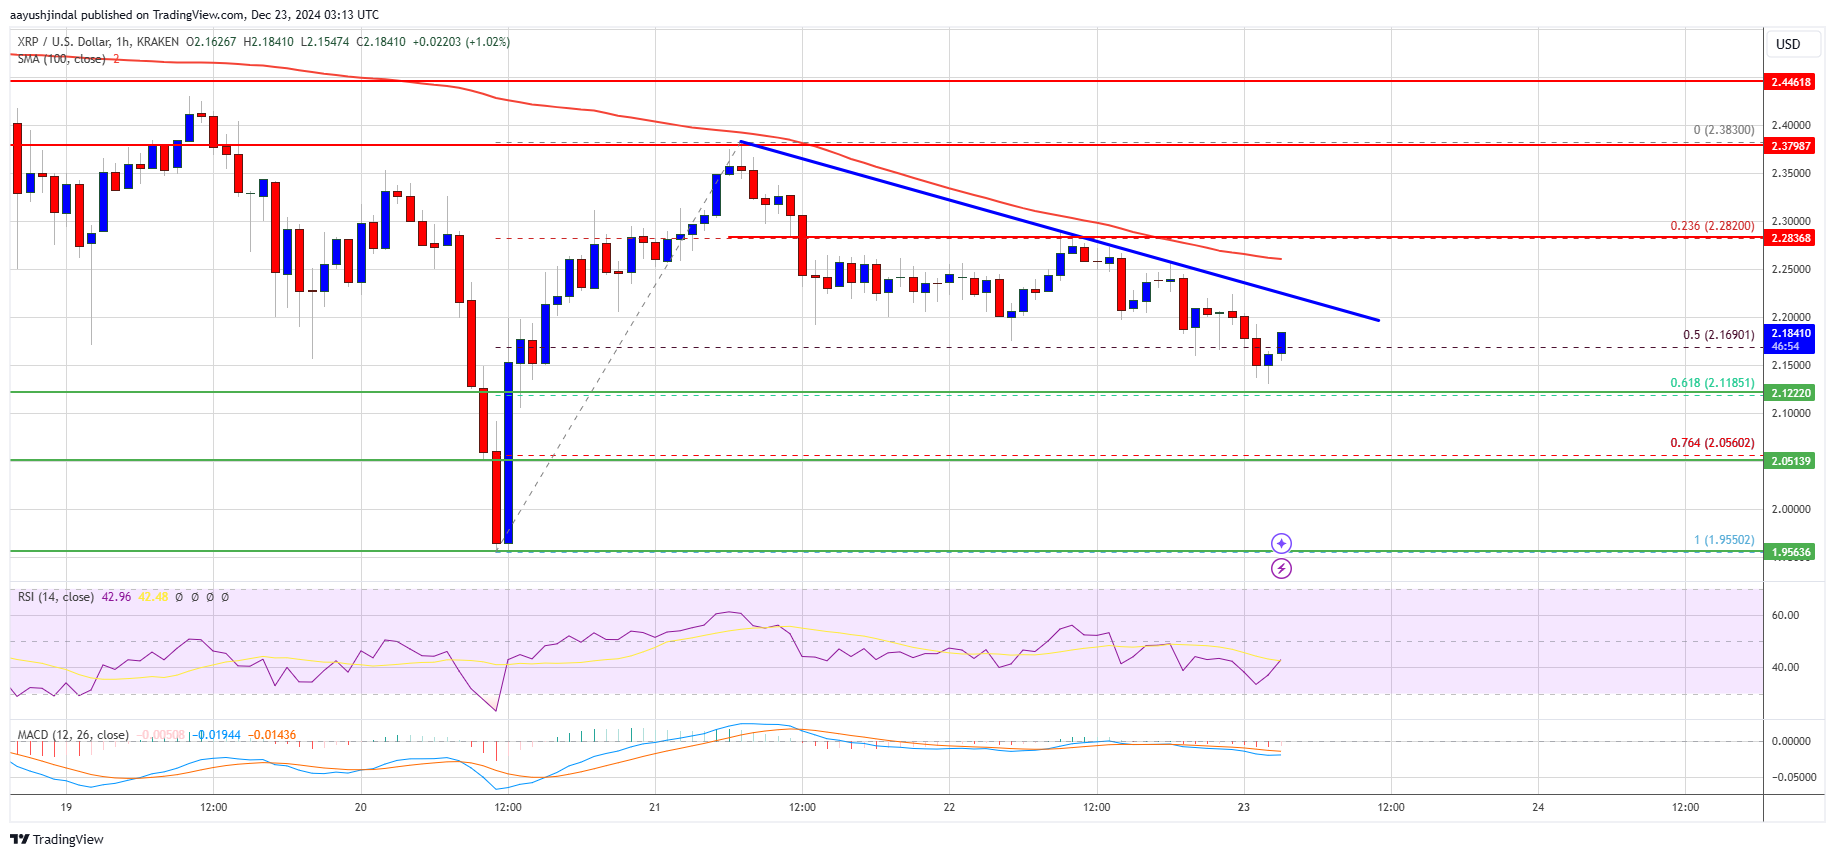
XRP began an increase from the $2.00 support level, contrasting with Bitcoin and Ethereum. However, selling pressure emerged near the $2.38 and $2.40 levels, leading to a new decline.
The price fell below $2.30 and $2.25, dipping beneath the 50% Fibonacci retracement level of the upward move from the $1.955 swing low to the $2.383 high. A bearish trend line is also forming with resistance at $2.25.
Currently, the price trades below $2.30 and the 100-hourly Simple Moving Average. Resistance may occur near $2.20 and the first major resistance is at $2.25.
The next resistance lies at $2.30. A clear move above this level could push the price toward $2.40, with potential gains targeting $2.50 or even $2.550. The bulls' next major hurdle is $2.620.
More Downsides?
If XRP fails to breach the $2.25 resistance, another decline could follow. Initial support is around $2.12 or the 61.8% Fibonacci retracement level from the $1.955 swing low to the $2.383 high. The next significant support level is near $2.050.
A break and close below the $2.050 level may lead to further declines toward the $2.00 support, with the next major support near the $1.880 zone.
Technical Indicators
Hourly MACD – The MACD for XRP/USD indicates increasing bearish momentum.
Hourly RSI (Relative Strength Index) – The RSI for XRP/USD is below the 50 level.
Major Support Levels – $2.120 and $2.050.
Major Resistance Levels – $2.25 and $2.30.