Sep 26, 2025
11 0
XRP Price Drops Below Support, Eyes Further Decline Below $2.720
XRP Price Movement Analysis
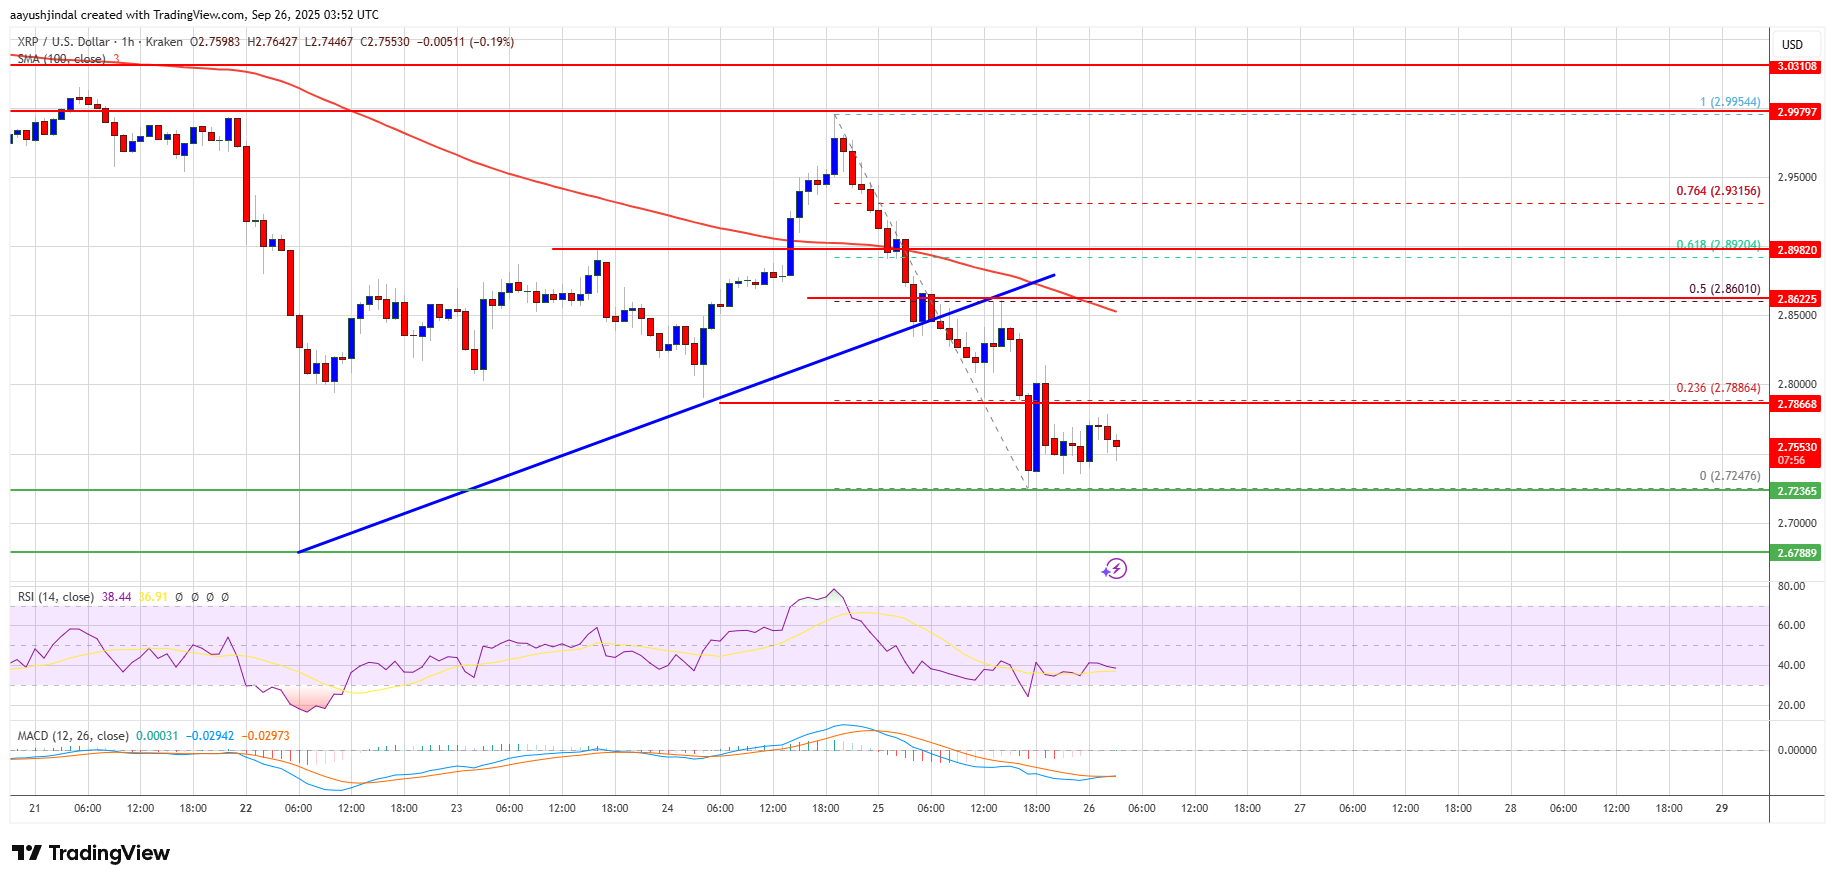
- XRP attempted a recovery above $2.850 but failed, now moving lower.
- Currently trading below $2.840 and the 100-hourly Simple Moving Average.
- Broke below a bullish trend line with support at $2.850 on the hourly chart (data from Kraken).
- Potential for further decline if it dips below $2.720.
- Price formed a high at $2.995 before declining to a low at $2.724.
- Consolidating below the 23.6% Fib retracement level of the drop from $2.995 to $2.724.
Resistance and Support Levels
- Resistance is expected near $2.788, with major resistance at $2.850 and 50% Fib retracement of the recent decline.
- A move above $2.850 could push the price towards $2.920 and potentially $2.950.
- If unable to breach $2.850, further declines are possible, with initial support at $2.720 and major support at $2.680.
- Further downside can lead to $2.6150, with significant support at $2.60.
Technical Indicators
- Hourly MACD: Gaining pace in the bearish zone.
- Hourly RSI: Below the 50 level.
- Major Support Levels: $2.720 and $2.680.
- Major Resistance Levels: $2.850 and $2.920.