Jan 28, 2026
3 0
BEARISH 📉 : XRP Price Fails To Break $2.00, Faces Further Declines
XRP Price Analysis
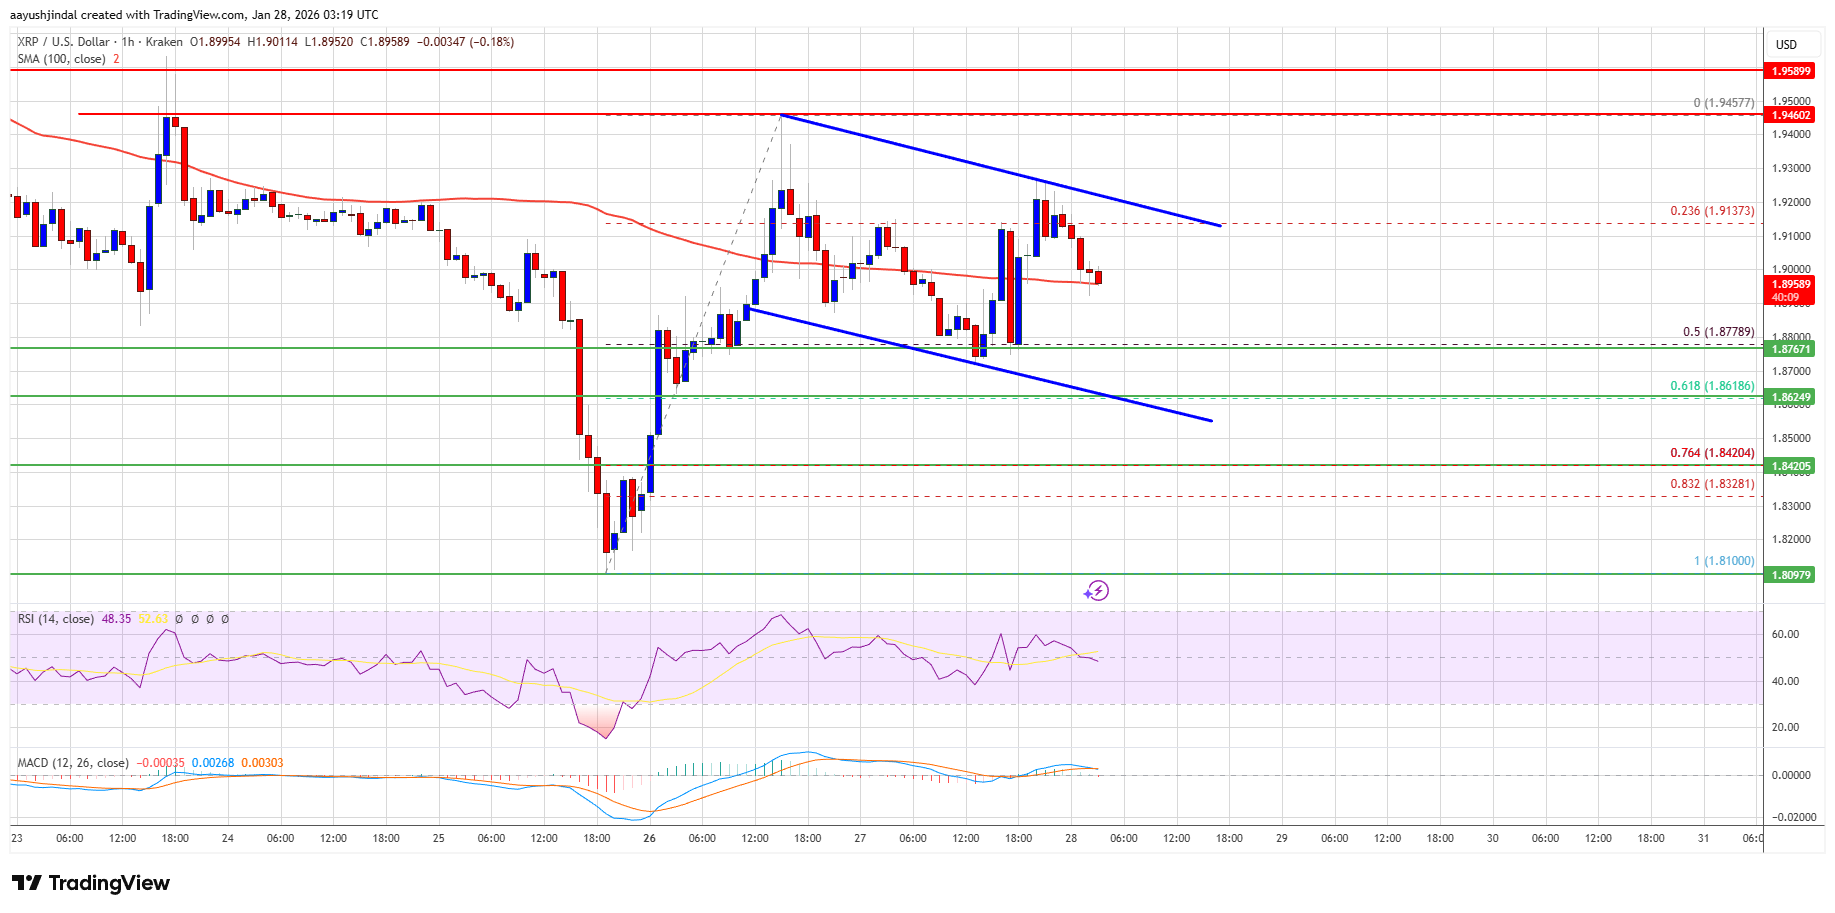
- XRP is struggling to break the $2.00 level and has begun a downside correction.
- Currently trading near $1.890, close to the 100-hourly Simple Moving Average.
- A declining channel or potential bullish flag pattern is forming with support at $1.860.
- To initiate another increase, XRP needs to clear the $1.950 resistance.
Resistance and Support Levels
- Immediate resistance: $1.920, major resistance: $1.950.
- Above $1.950, the price could test $2.00 and further targets at $2.050 and $2.120.
- Initial support: $1.880, major support: $1.860.
- If $1.860 fails, further decline towards $1.8320 and potentially $1.80 is possible.
Technical Indicators
- Hourly MACD for XRP/USD is gaining momentum in the bearish zone.
- Hourly RSI is below the 50 level, indicating potential weakness.
This analysis highlights the critical levels for XRP investors to monitor, as breaking or holding these levels will determine its next move.