XRP Price Declines After Failing to Reach $2.9 Resistance Level
XRP's upward momentum has declined after failing to reclaim its previous high of $2.9, leading to a drop toward prior support levels. This rejection raises concerns about the bulls' ability to regain control and push prices higher.
Bearish Build-Up On The 4-Hour Timeframe
As bearish pressure increases, attention turns to key support zones. The bulls must maintain strength against downward movement to prevent XRP from deeper corrections. Analysis of the 4-hour chart shows negative sentiment as XRP attempts to drop below the 100-day Simple Moving Average (SMA), trending toward the $1.9 support level. Continued descent suggests intensifying selling pressure; failure to hold this support could lead to further declines.
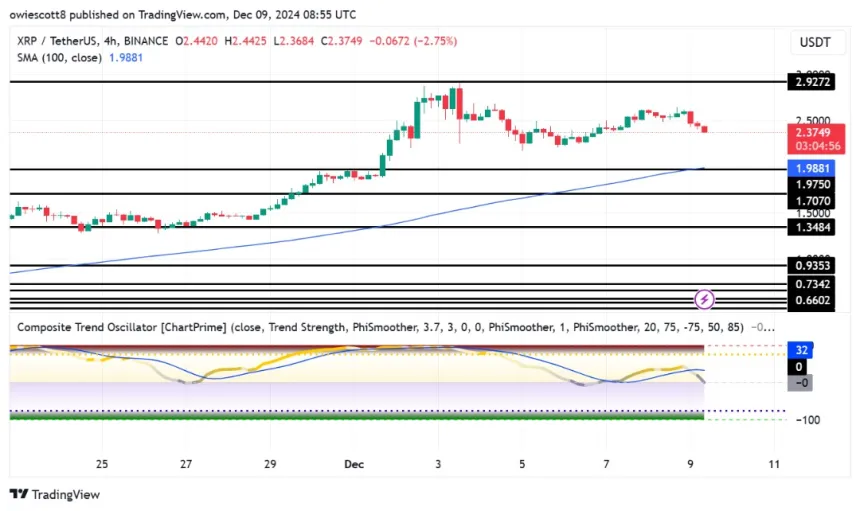
The Composite Trend Oscillator on the 4-hour chart indicates a potential shift in momentum, with the trend line falling below the SMA line. This suggests challenges in sustaining upward movements and moderate bearish pressure, indicating cautious market sentiment. A continued drop in the signal line may trigger increased selling activity.
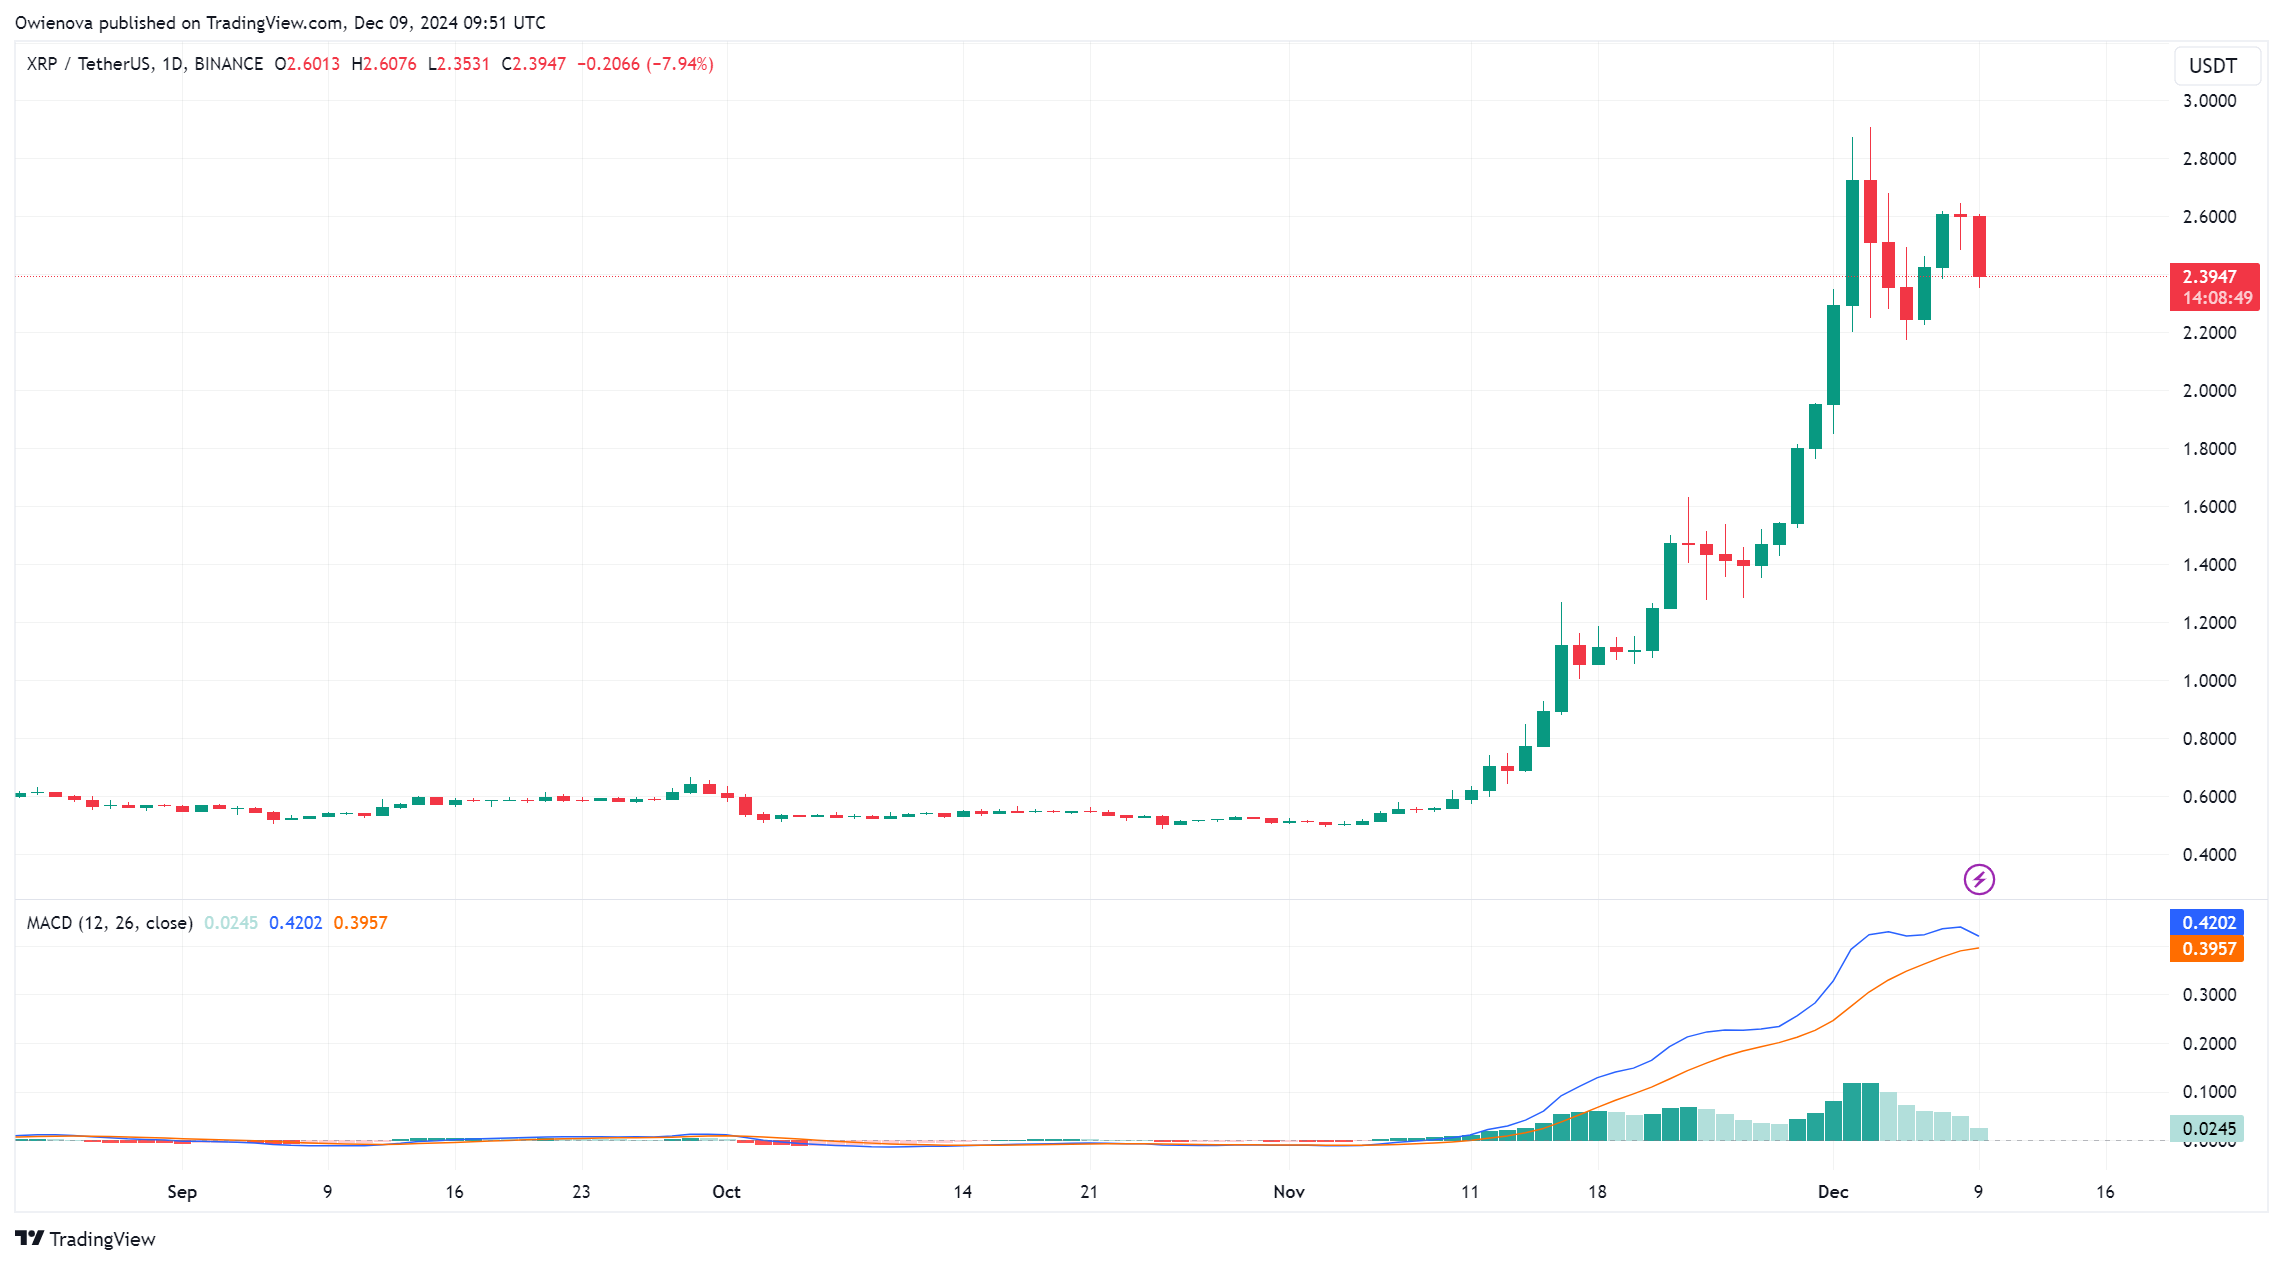
Price Set Up For XRP On The 1-Day Timeframe
The daily chart highlights significant downward movement, marked by a bearish candlestick following a failed recovery attempt toward $2.9. Inability to sustain an uptrend reflects diminished buyer confidence and prevailing pessimism. As XRP approaches the $1.9 support level, seller pressure is likely to increase, raising concerns about a potential breakdown.

The 1-day Composite Trend Oscillator indicates growing bearish momentum, with the signal line dropping below the SMA after remaining in the overbought zone. This suggests a possible shift in market dynamics, where overbought conditions may lead to increased selling pressure. A crossover below the SMA often signals weakening upside momentum.
Key support levels are crucial for XRP's next move. The first level to monitor is $1.9, which could act as an initial buffer against declines. A sustained break below this level might lead to a deeper drop toward $1.7, a region of significant historical activity. If bearish momentum continues, the $1.3 mark may serve as the last defense before a broader selloff occurs.