XRP Price Stabilizes at $2.13 and $2.92 Amid Market Correction
Technical analysis of XRP indicates the formation of corrective waves following a recent price correction since December 3. The cryptocurrency is currently trading within crucial Fibonacci levels, with analyst Dark Defender noting $2.13 and $2.92 as significant price points.
XRP Tests Fibonacci Levels Amid Market Correction
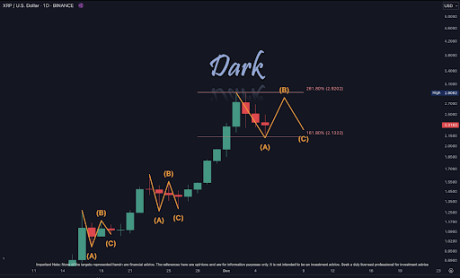
The XRP chart illustrates that the earlier rally peaked at approximately $2.92 on Binance, coinciding with the 261.80% Fibonacci extension level. However, this high was followed by a correction, dropping the price to a support level at $2.17, which is just above the 161.80% Fibonacci extension level at $2.13. This makes $2.13 a critical support level moving forward.
Dark Defender emphasizes that the key price levels to monitor are $2.92 and $2.17. The rebound from $2.17 suggests the correction may be nearing its end, transitioning into Wave B in the daily time frame.
What To Expect During Wave B
This analysis follows a three-corrective-wave pattern consisting of Waves A, B, and C. In this structure, Waves A and C indicate downward trends, while Wave B signifies an upward movement. If this pattern repeats, XRP may climb to $2.92 before facing another downward trend, potentially retesting support at $2.13.
Dark Defender suggests it may take several days for this structure to resolve, meaning XRP could continue to fluctuate between these levels before making a decisive move.
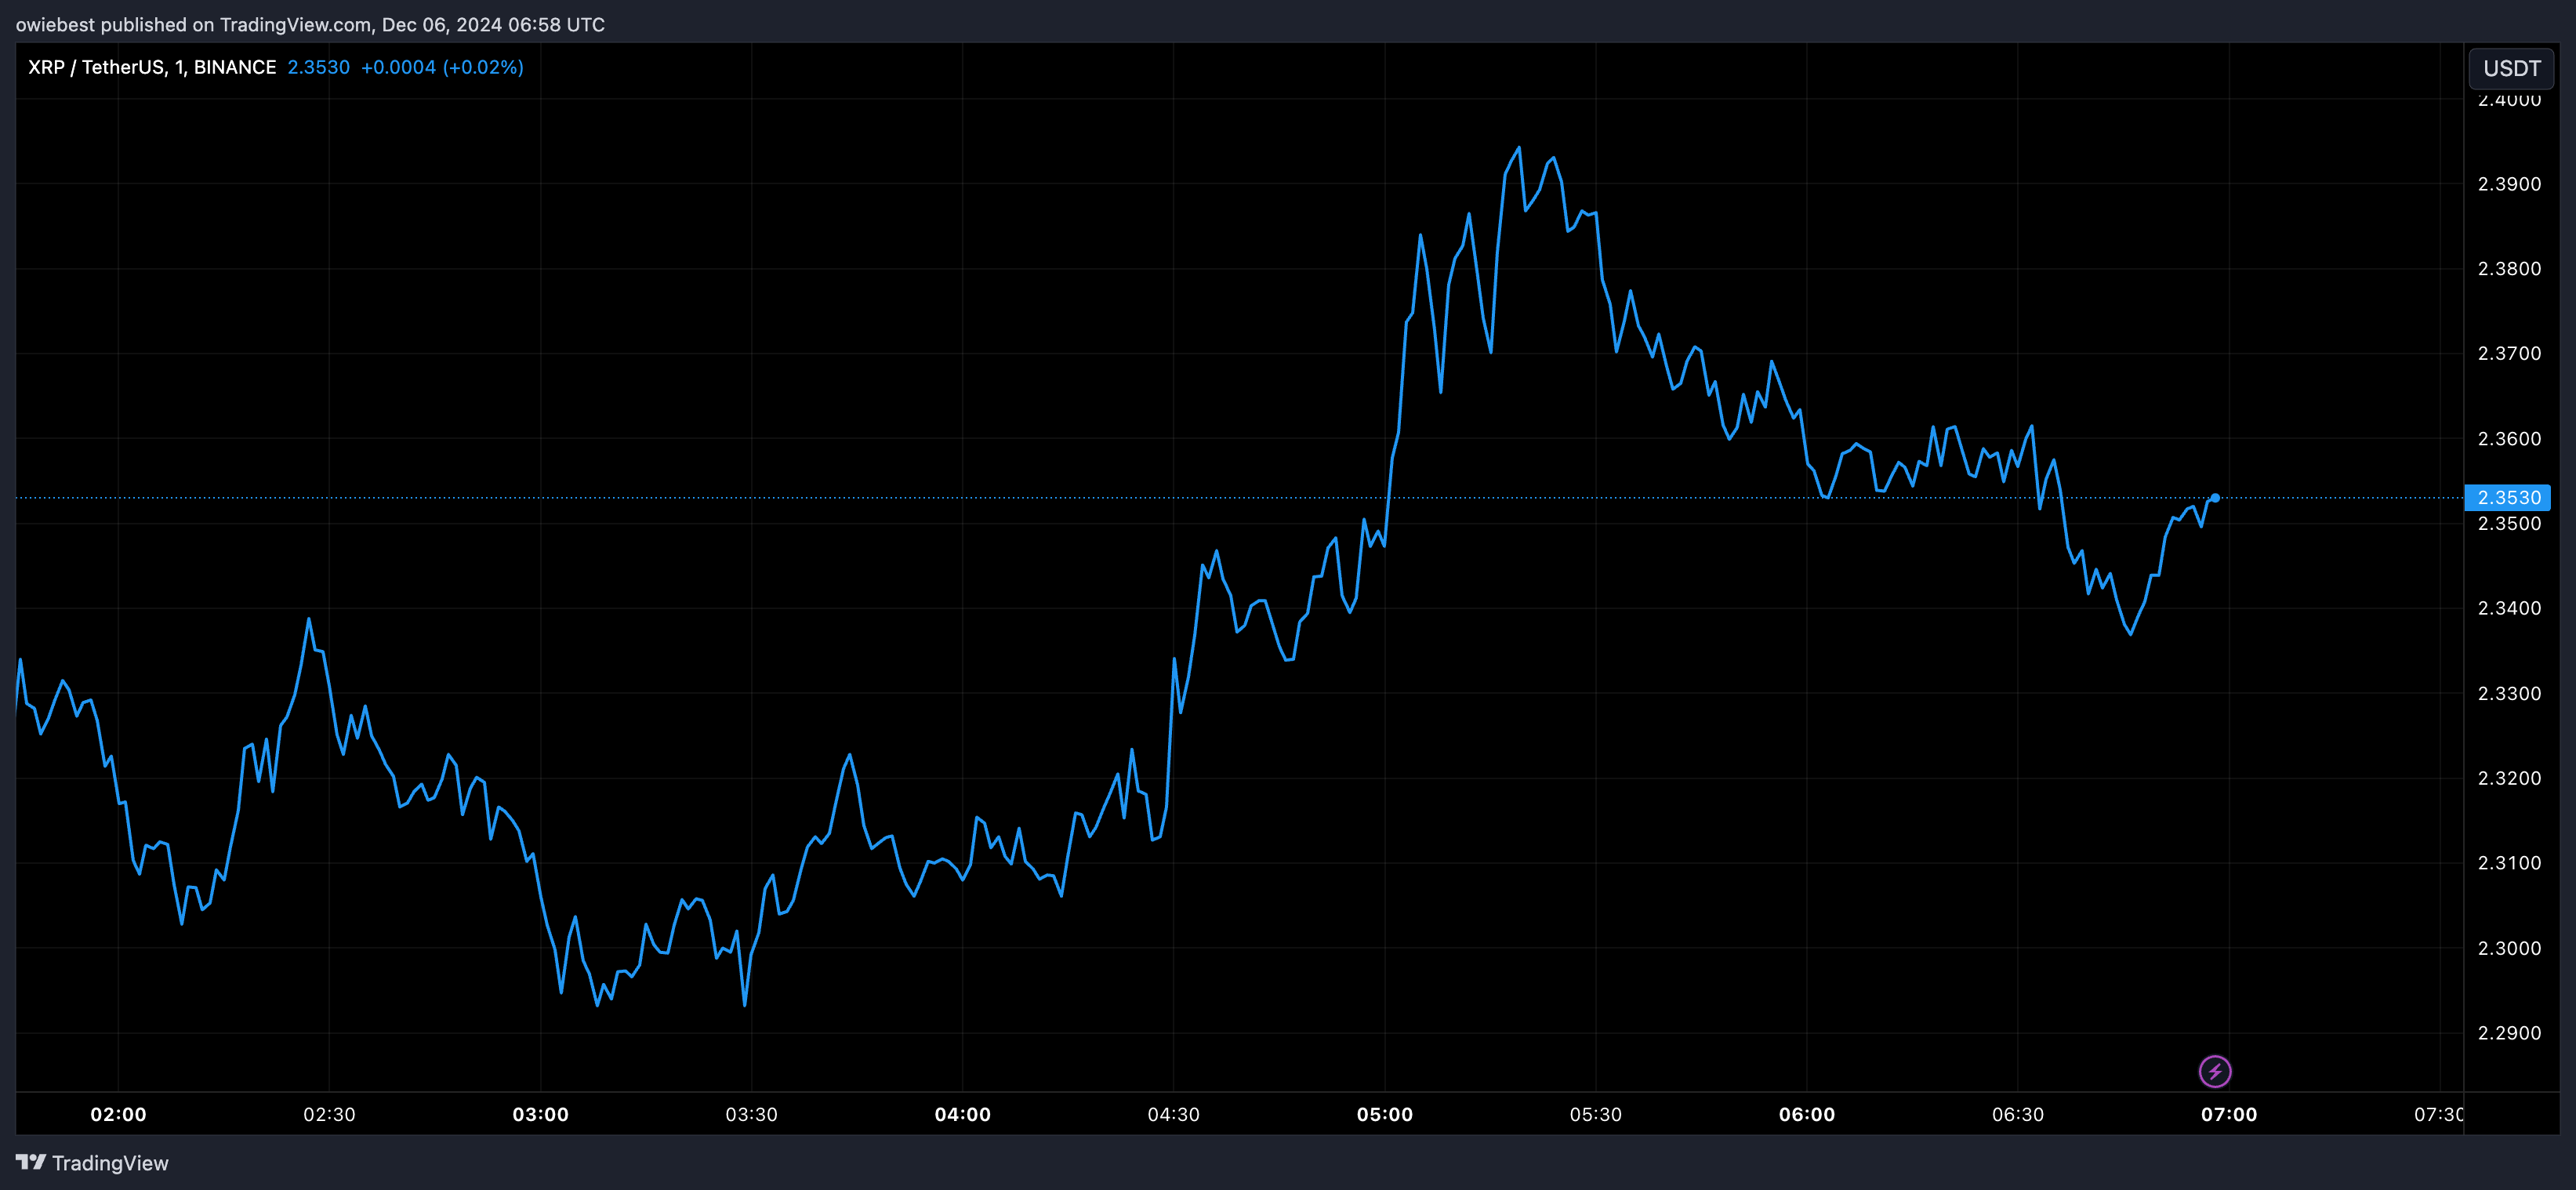
Market factors indicate a potential upward breakout, positioning XRP for new multi-year highs. Currently, XRP trades at $2.37, up 2.9% in the past 24 hours. Contributing to this positive outlook is the nomination of Paul Atkins by President-elect Donald Trump to lead the SEC, seen as favorable for the crypto industry. His leadership could resolve the ongoing SEC-Ripple legal dispute, likely attracting substantial institutional and retail investment into the XRP ecosystem.