XRP Price Holds $0.5020 Support While Eyeing $0.5250 Resistance
XRP price is maintaining support at $0.5020 while outperforming Bitcoin, with potential for movement above the $0.5250 resistance level.
- XRP aims for gains above the $0.5250 zone.
- Current trading is below $0.5200 and the 100-hourly Simple Moving Average.
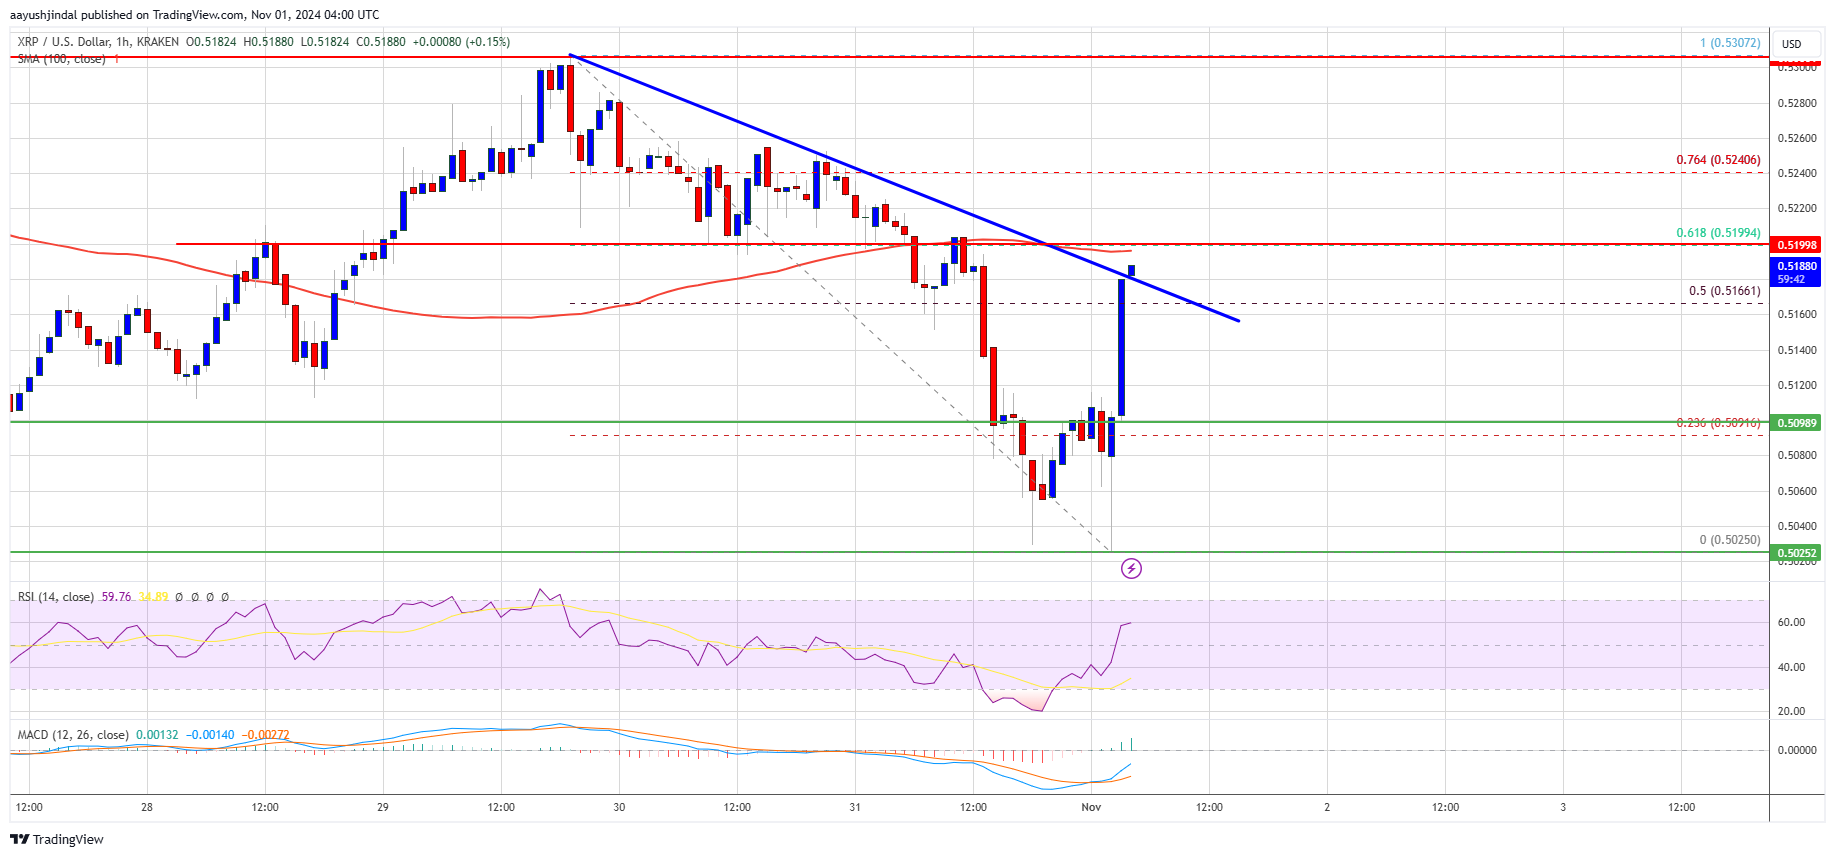
- A break occurred above a bearish trend line with resistance at $0.5185 on the hourly XRP/USD chart (data from Kraken).
- The pair could gain momentum if it settles above the $0.5200 resistance zone.
XRP Price Eyes Upside Break
XRP extended losses below the $0.5120 support zone and declined past $0.5050 before rebounding, with losses less severe compared to Bitcoin and Ethereum.
A low of $0.5025 was established, followed by an increase above the $0.5050 and $0.5120 resistance levels, surpassing the 50% Fibonacci retracement of the drop from $0.5307 to $0.5025.
The price remains below $0.5200 and the 100-hourly Simple Moving Average after breaking above the key bearish trend line at $0.5185.
Resistance may emerge near $0.5200 or the 61.8% Fibonacci retracement of the decline from $0.5307 to $0.5025. The first significant resistance is around $0.5240.
The next key resistance is at $0.5300, with further movement above this level potentially leading to $0.5350. Additional gains may push prices toward $0.5500 or $0.5550, with a major hurdle at $0.5850.
Another Decline?
If XRP does not clear the $0.5200 resistance, a decline may follow. Initial support is near $0.5120, with the next major support at $0.5085.
A downside break and close below $0.5085 could lead to a decline towards the $0.5020 support level, with further support at $0.4880.
Technical Indicators
Hourly MACD – The MACD for XRP/USD shows increasing bullish momentum.
Hourly RSI (Relative Strength Index) – The RSI for XRP/USD is above 50.
Major Support Levels – $0.5150 and $0.5085.
Major Resistance Levels – $0.5200 and $0.5240.
