Jan 7, 2026
4 0
XRP Price Surges Above $2 Following 2017-Like Chart Pattern
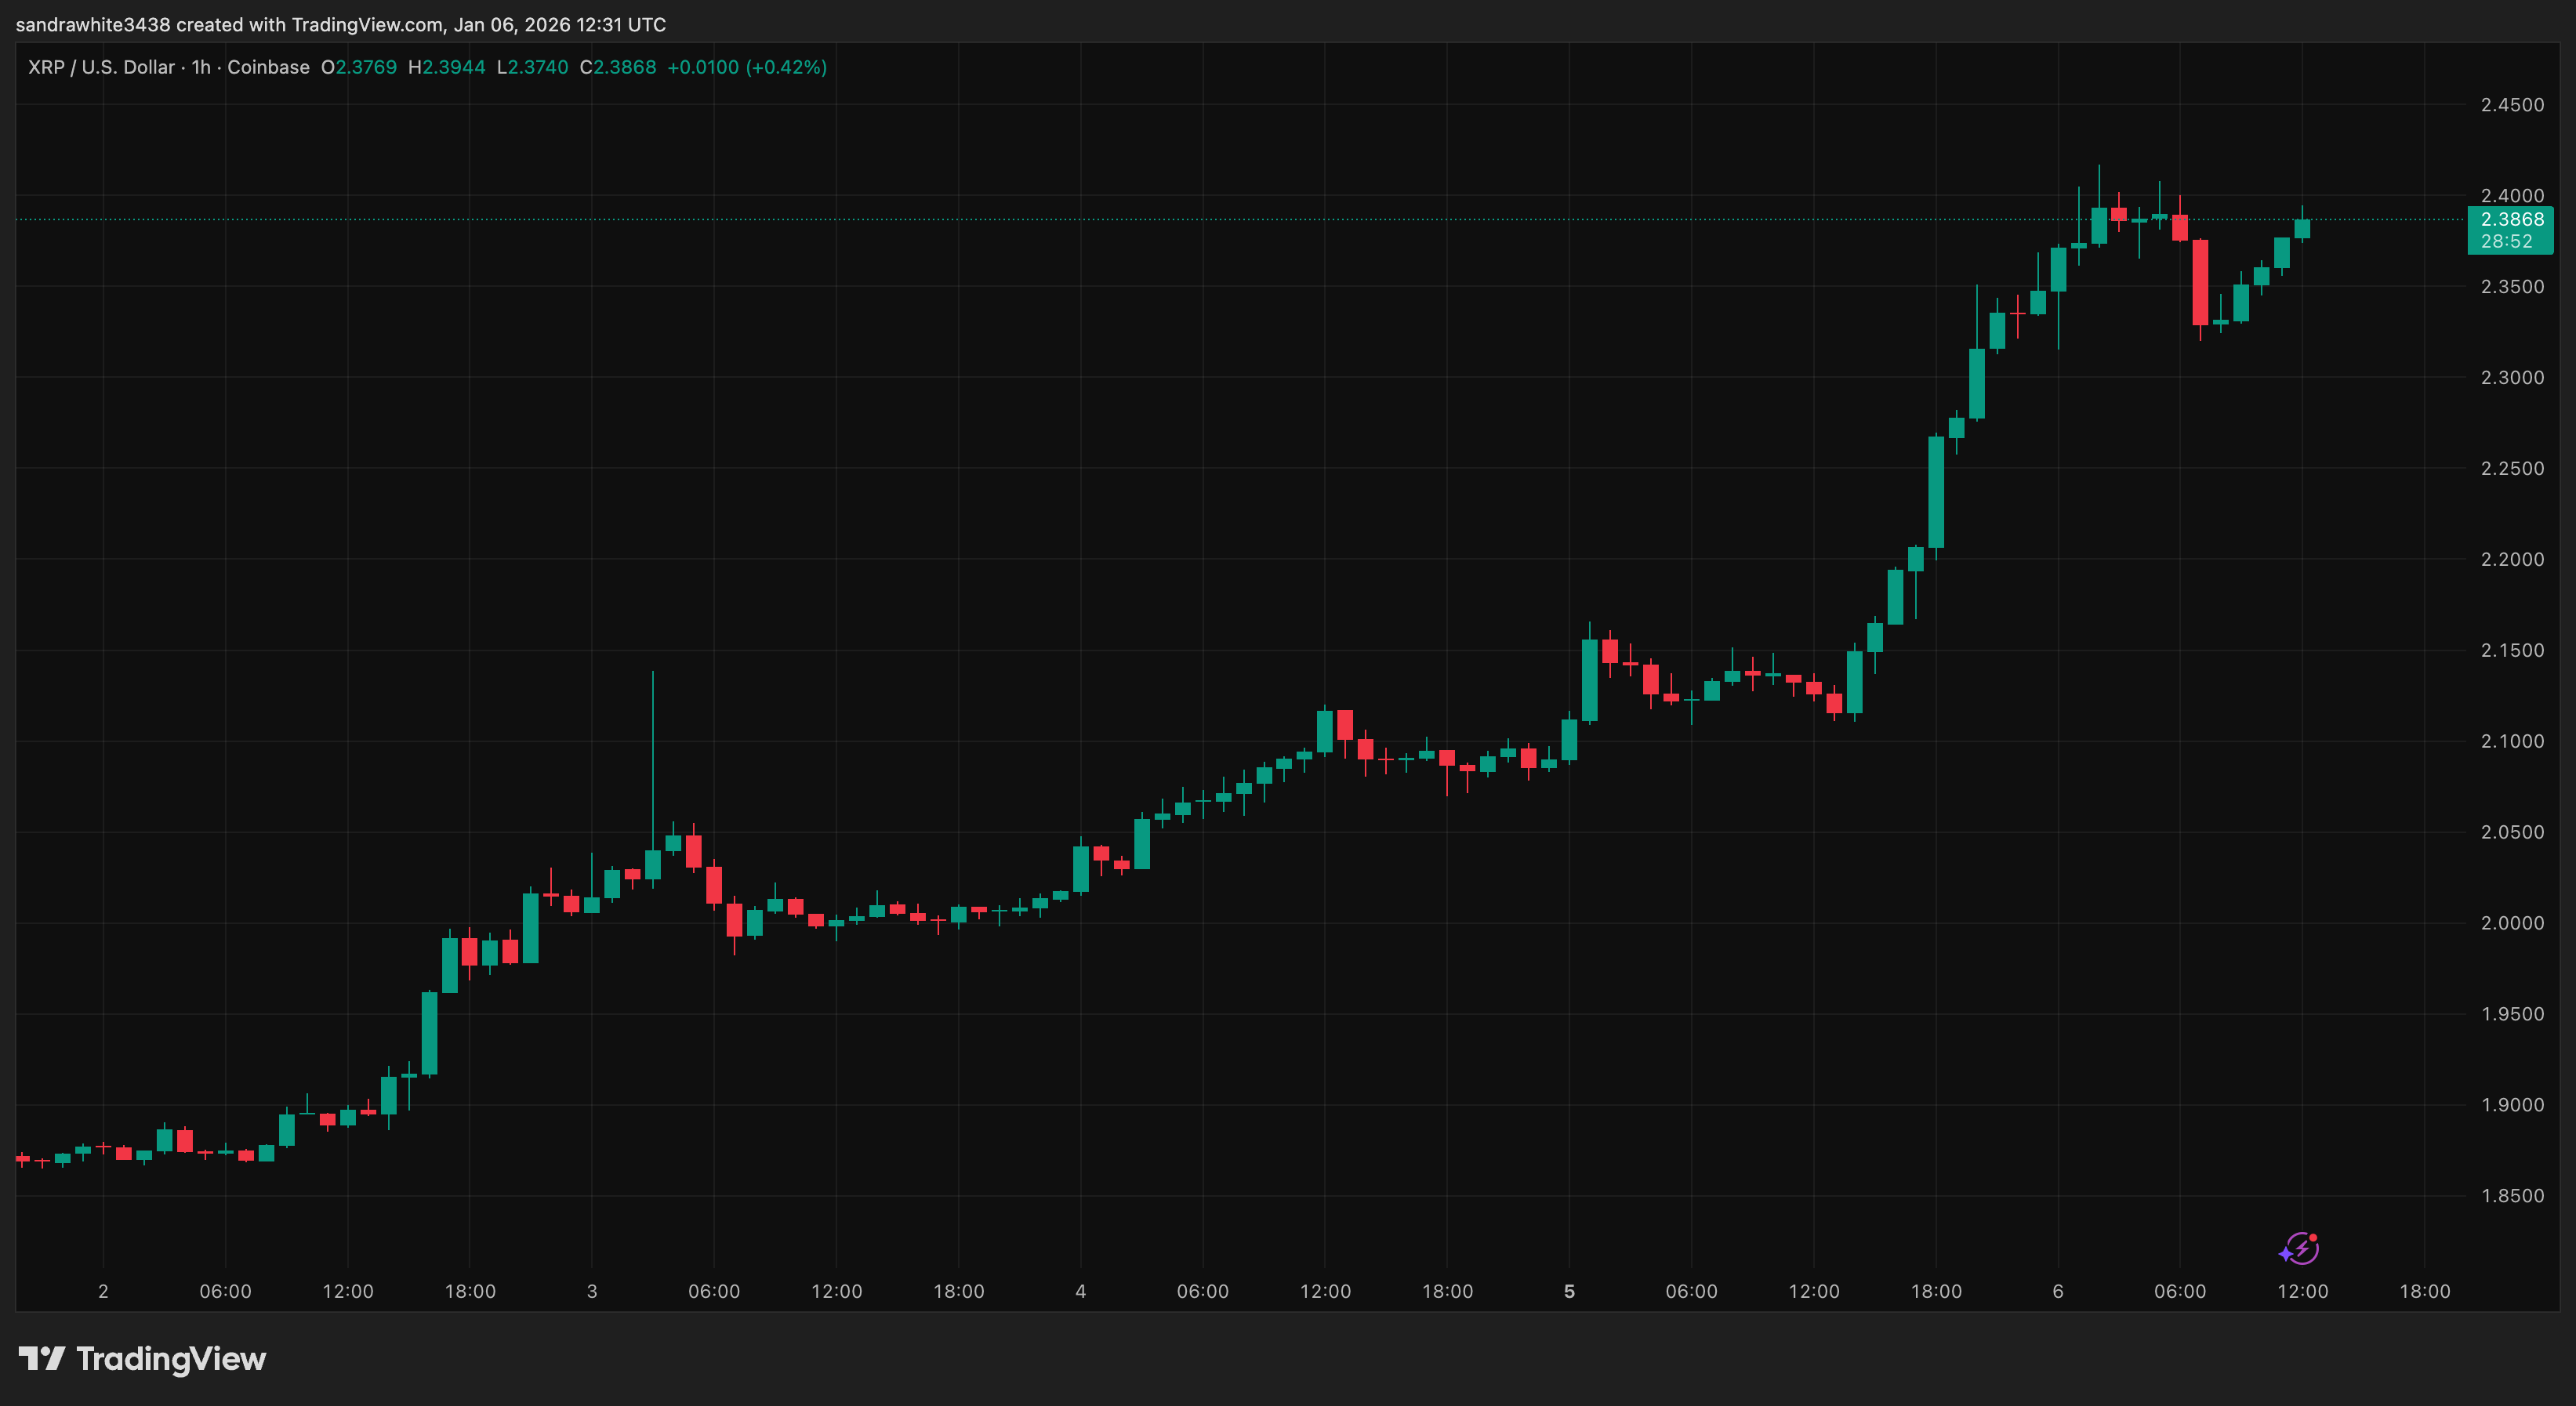
XRP has experienced a price increase over the past 48 hours, moving from below $2 to trading near $2.40. This rise is not just a bounce, as it mirrors the price action before XRP's significant breakout in 2017.
Historical Price Action Comparison
- XRP's current weekly candlestick chart resembles its 2017 pattern on the 3-day chart.
- In 2017, XRP followed a five-wave sequence alternating between declines and recoveries.
- The final wave formed a falling wedge, with prices stabilizing around $0.00485 before breaking out.
- This breakout led to a rally exceeding 1,000%, pushing XRP above $0.02.
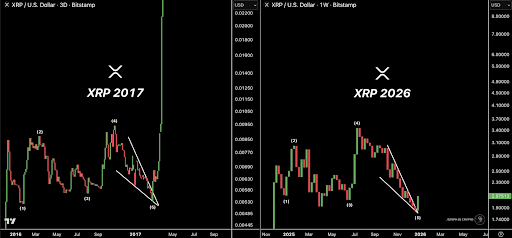
Recent analysis suggests XRP is tracing a similar pattern. After reaching $3.40 in mid-2025, it entered a corrective phase, forming another falling wedge and finding support at $1.74.
Current Price Dynamics
- XRP is now trading above $2 and appears to be breaking out of the falling wedge.
- A potential 1,000% rally could target a price around $22.
- Key resistance levels include $2.30, $2.50, $2.80, $3.10, and $3.40.
- Weakness below $1.90 or a return to $1.74 would challenge the recovery narrative.