Oct 30, 2025
6 0
XRP Price Faces Resistance at $2.65 Amid Bearish Trend
XRP's price is currently experiencing fluctuations and struggles to maintain momentum above $2.650.
- After peaking near $2.69, XRP has faced a decline, trading below $2.60 and the 100-hourly Simple Moving Average.
- A bearish trend line forms resistance at $2.65 on the hourly chart of the XRP/USD pair.
- If XRP remains above $2.5120, it could start a fresh upward movement.
Price Dynamics
XRP dipped below the $2.65 level and tested the 23.6% Fib retracement from $2.327 to $2.697. It stabilized above $2.50 but remains vulnerable to further declines if unable to clear $2.650.
Resistance levels are at $2.620 and $2.650, with potential moves towards $2.720 if these are surpassed. Conversely, failure to break $2.650 may lead to a drop towards supports at $2.550 and $2.5120.
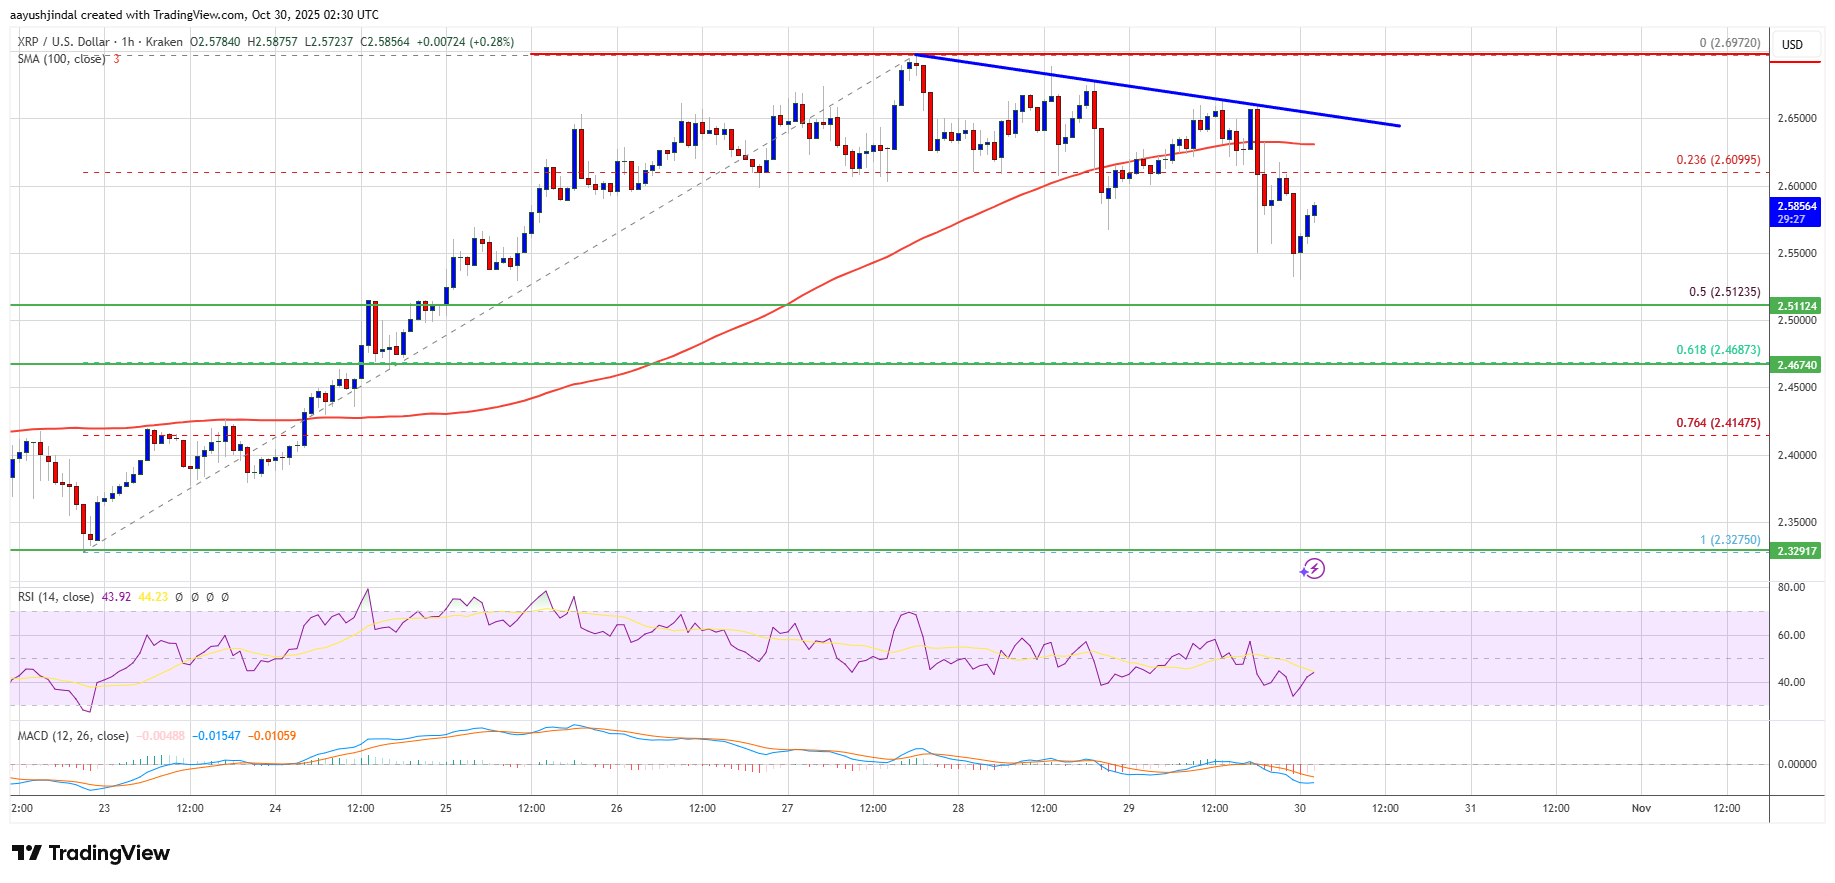
Technical Indicators
- MACD: Losing pace in the bearish zone.
- RSI: Below the 50 level, indicating weakness.
- Support Levels: $2.550 and $2.5120.
- Resistance Levels: $2.620 and $2.650.