Oct 30, 2025
9 0
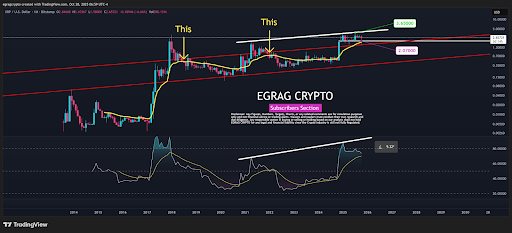
XRP RSI Indicator Confirms Strong Uptrend, Eyes $3.65 Target
The XRP price chart shows a key technical indicator, the Relative Strength Index (RSI), climbing in tandem with the price, indicating strong momentum. Analyst EGRAG CRYPTO suggests this alignment confirms a healthy uptrend driven by buying pressure.
Key Points
- Both price and RSI making higher highs signal a strong, genuine uptrend, contrasting with bearish divergence where price rises but RSI falls.
- The RSI has an ascending slope of about 9.32°, matching XRP’s price increase over the past year, suggesting sustainable trend support.
- XRP has broken above its long-term ascending parallel channel, reflecting bullish momentum similar to the 2017/2018 rally.
- The yellow moving average line is upward sloping beneath the candles, providing dynamic support and showing improved market structure.
Next Steps for XRP
- $2.07 is identified as a major support level, with $3.65 as a near-term target, aligning with July 2025's all-time high.
- If XRP maintains above the midpoint breakout zone, a return to $3.65 is likely.
- As long as XRP holds above $2.07 and $2.50, the uptrend remains intact, supported by RSI momentum.
- Currently, XRP is trading at $2.58, slightly down from its intraday high of $2.66, attempting to reclaim $2.60.