Jan 17, 2026
2 0
XRP Aims for 1,250% Growth Following 2017 Pattern Repeat
XRP Price Movement and Analysis
- XRP recently hit a 12-day low at $2.02 but has been trading between $2.05-$2.35 for nearly two weeks.
- Analyst Sjuul from AltCryptoGems notes a potential bullish market structure break with a fresh higher high, suggesting XRP might reverse its downtrend.
- Market observer ChartNerd highlights a similarity with XRP's 2017 price patterns, potentially indicating significant upcoming growth.
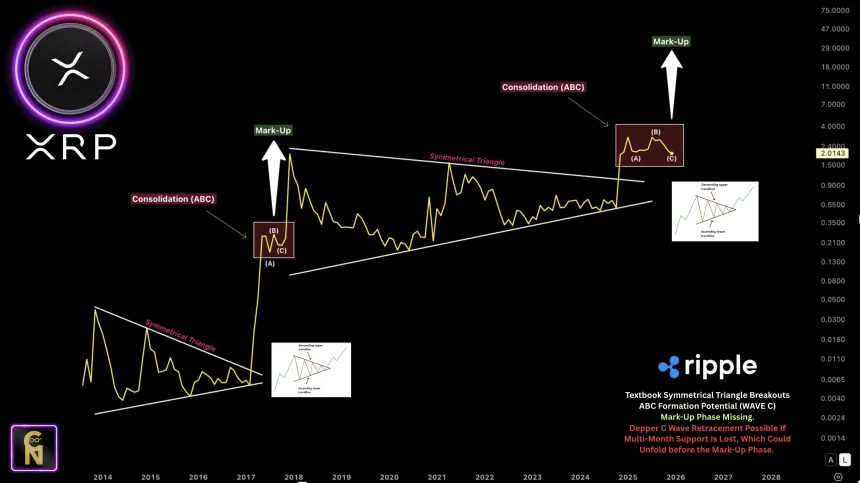
- XRP broke out of a multi-year symmetrical triangle pattern and is currently in Wave C of its ABC consolidation period.
- If the $1.80 support level is lost, a deeper Wave C retracement could occur. However, the cycle formula repetition hints at an expansion towards $8/$13/$27, representing a 300%-1,250% increase.
Q1 Outlook for XRP
- ChartNerd warns that XRP has just over 2 months to invalidate a bearish Heikin-Ashi candle formation or face a significant correction.
- Historically, such formations have led to downtrends or macro consolidation periods, as seen in 2014, 2018, and 2021.
- XRP needs to avoid closing this quarter with a full-bodied three-month bearish candle to prevent a prolonged downturn.
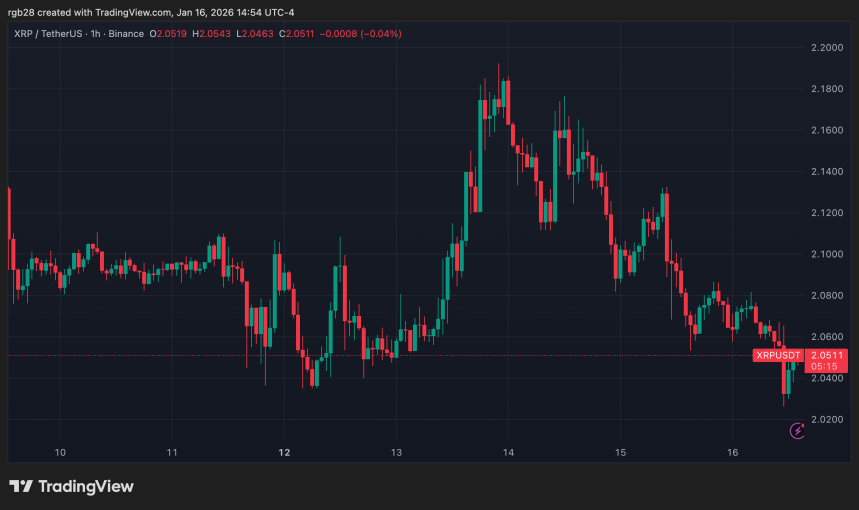
Currently, XRP trades at $2.05, showing a 1.7% decline over the past week.