Feb 12, 2026
4 0
BEARISH 📉 : Bitcoin price declines as $65,000 becomes key support level
Bitcoin's price has dropped below $68,800 and is showing signs of further decline.
- Currently trading below $68,800 and $68,000.
- Below the 100 hourly simple moving average.
- A bearish trend line with resistance at $68,200 is forming on the BTC/USD hourly chart.
- If it falls below $66,500 and $65,000, further dips are likely.
Current Price Movement
The price dipped past the 50% Fib retracement from the $60,500 low to the $72,256 high. Resistance is expected near $68,200.
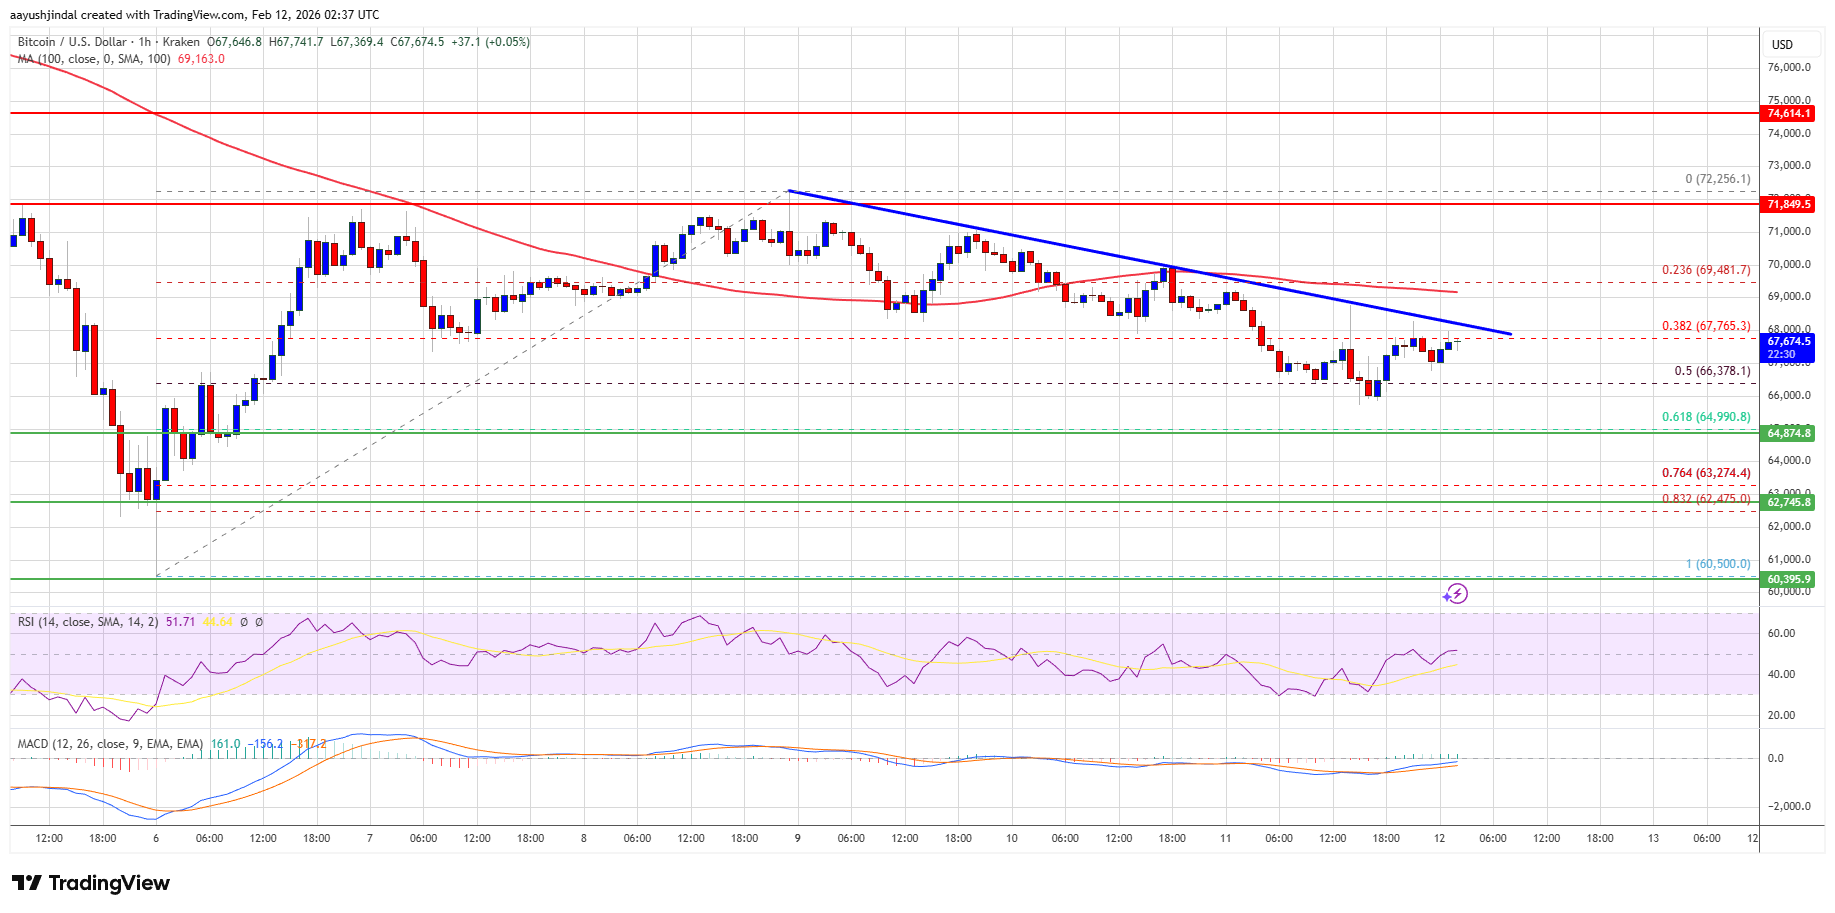
Key resistance levels are $69,000 and potentially $70,000. Surpassing these could push the price to $71,500 or higher.
Potential Downward Risks
- If unable to exceed $69,000, immediate support lies at $66,000.
- Major support is at $65,000; a fall below could target $63,500 and $62,000.
- Main support is now $61,200, a crucial level for potential recovery.
Technical Indicators:
- Hourly MACD: Bearish momentum increasing.
- Hourly RSI: Below 50, indicating weakness.