Feb 19, 2026
2 0
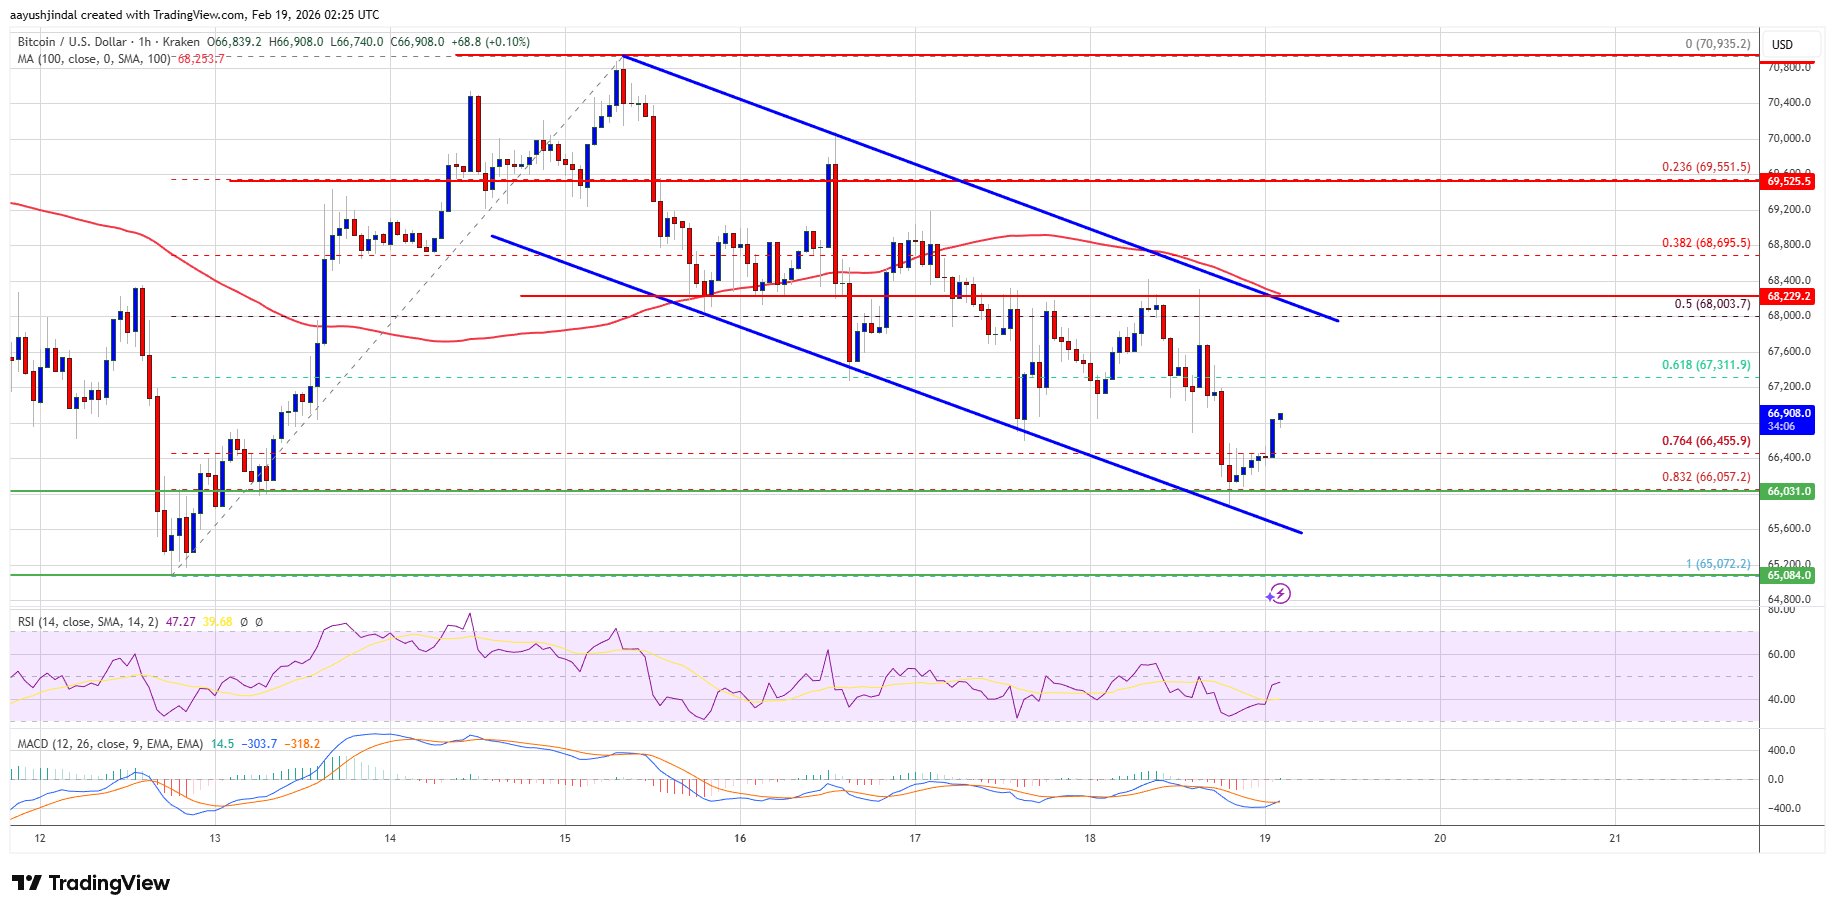
BEARISH 📉 : Bitcoin faces further decline, struggles below $67,200
Bitcoin's price has seen a correction, testing the support at $66,000. It is currently consolidating losses and may decline further if it breaks below the $65,500 zone.
- BTC struggles below $67,200 and the 100 hourly simple moving average.
- A declining channel with resistance at $68,000 is forming on the hourly BTC/USD chart.
- The price dipped below the 76.4% Fib retracement level from the $65,072 low to the $70,935 high.
- Immediate resistance levels are at $67,350 and $68,000.
- If Bitcoin breaks above $68,000, it could rise towards $68,800 and potentially $69,500.
Potential for Further Decline
- If BTC fails to surpass the $68,000 resistance, another decline might occur.
- Immediate support resides near $66,000, with major support at $65,500.
- A further drop could target supports at $64,200 and $63,500.
Technical Indicators
- Hourly MACD: Increasing in the bearish zone.
- Hourly RSI: Below the 50 level.
- Support Levels: $66,000, $65,000.
- Resistance Levels: $67,350, $68,000.