Mar 2, 2026
1 0
BEARISH 📉 : Bitcoin struggles below resistance with potential downside risks
Bitcoin Price Movement
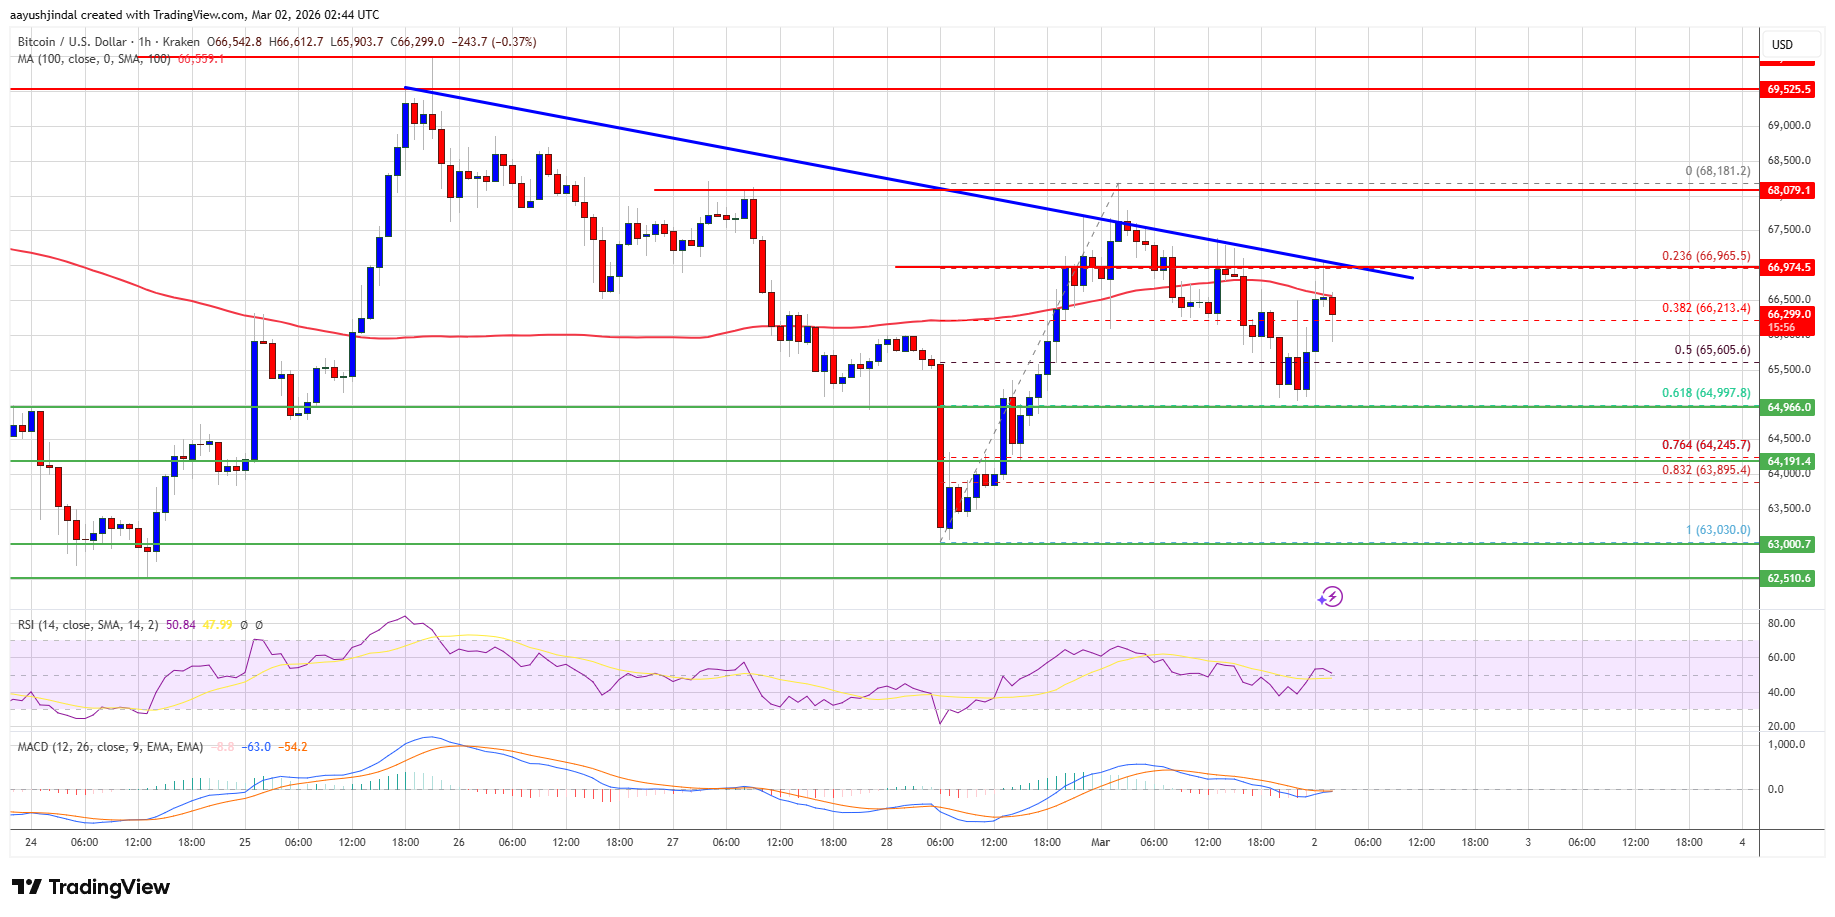
- Bitcoin increased above $66,000 and is consolidating around this level.
- Currently trading below $67,000 and the 100 hourly simple moving average.
- A bearish trend line resistance is at $67,000 on the BTC/USD hourly chart.
- If Bitcoin falls below $65,500 and $65,000, it may dip further.
Resistance Levels and Potential Upside
- Bitcoin formed a base above $63,500 and surpassed the $64,500 resistance zone.
- Recently corrected gains after reaching a high of $68,180.
- Key resistances: $67,000 and $68,200. A close above $68,200 could push the price towards $69,500 and potentially $70,000.
- Ultimate resistance targets are $70,500 and $71,200.
Potential Downside
- If unable to surpass $67,000, Bitcoin may decline further.
- Immediate support levels are at $65,500 and $65,000.
- Further support exists at $64,250 and $64,000. Main support stands at $63,000.
Technical Indicators
- Hourly MACD is losing pace in the bullish zone.
- The RSI for BTC/USD is above the 50 level.
- Major Support Levels: $65,500 and $65,000.
- Major Resistance Levels: $67,000 and $68,200.