6 0
Bitcoin Eyes $135K Amid Strong Uptrend; Dollar and Yields Pose Risks
Bitcoin's (BTC) Current Trajectory
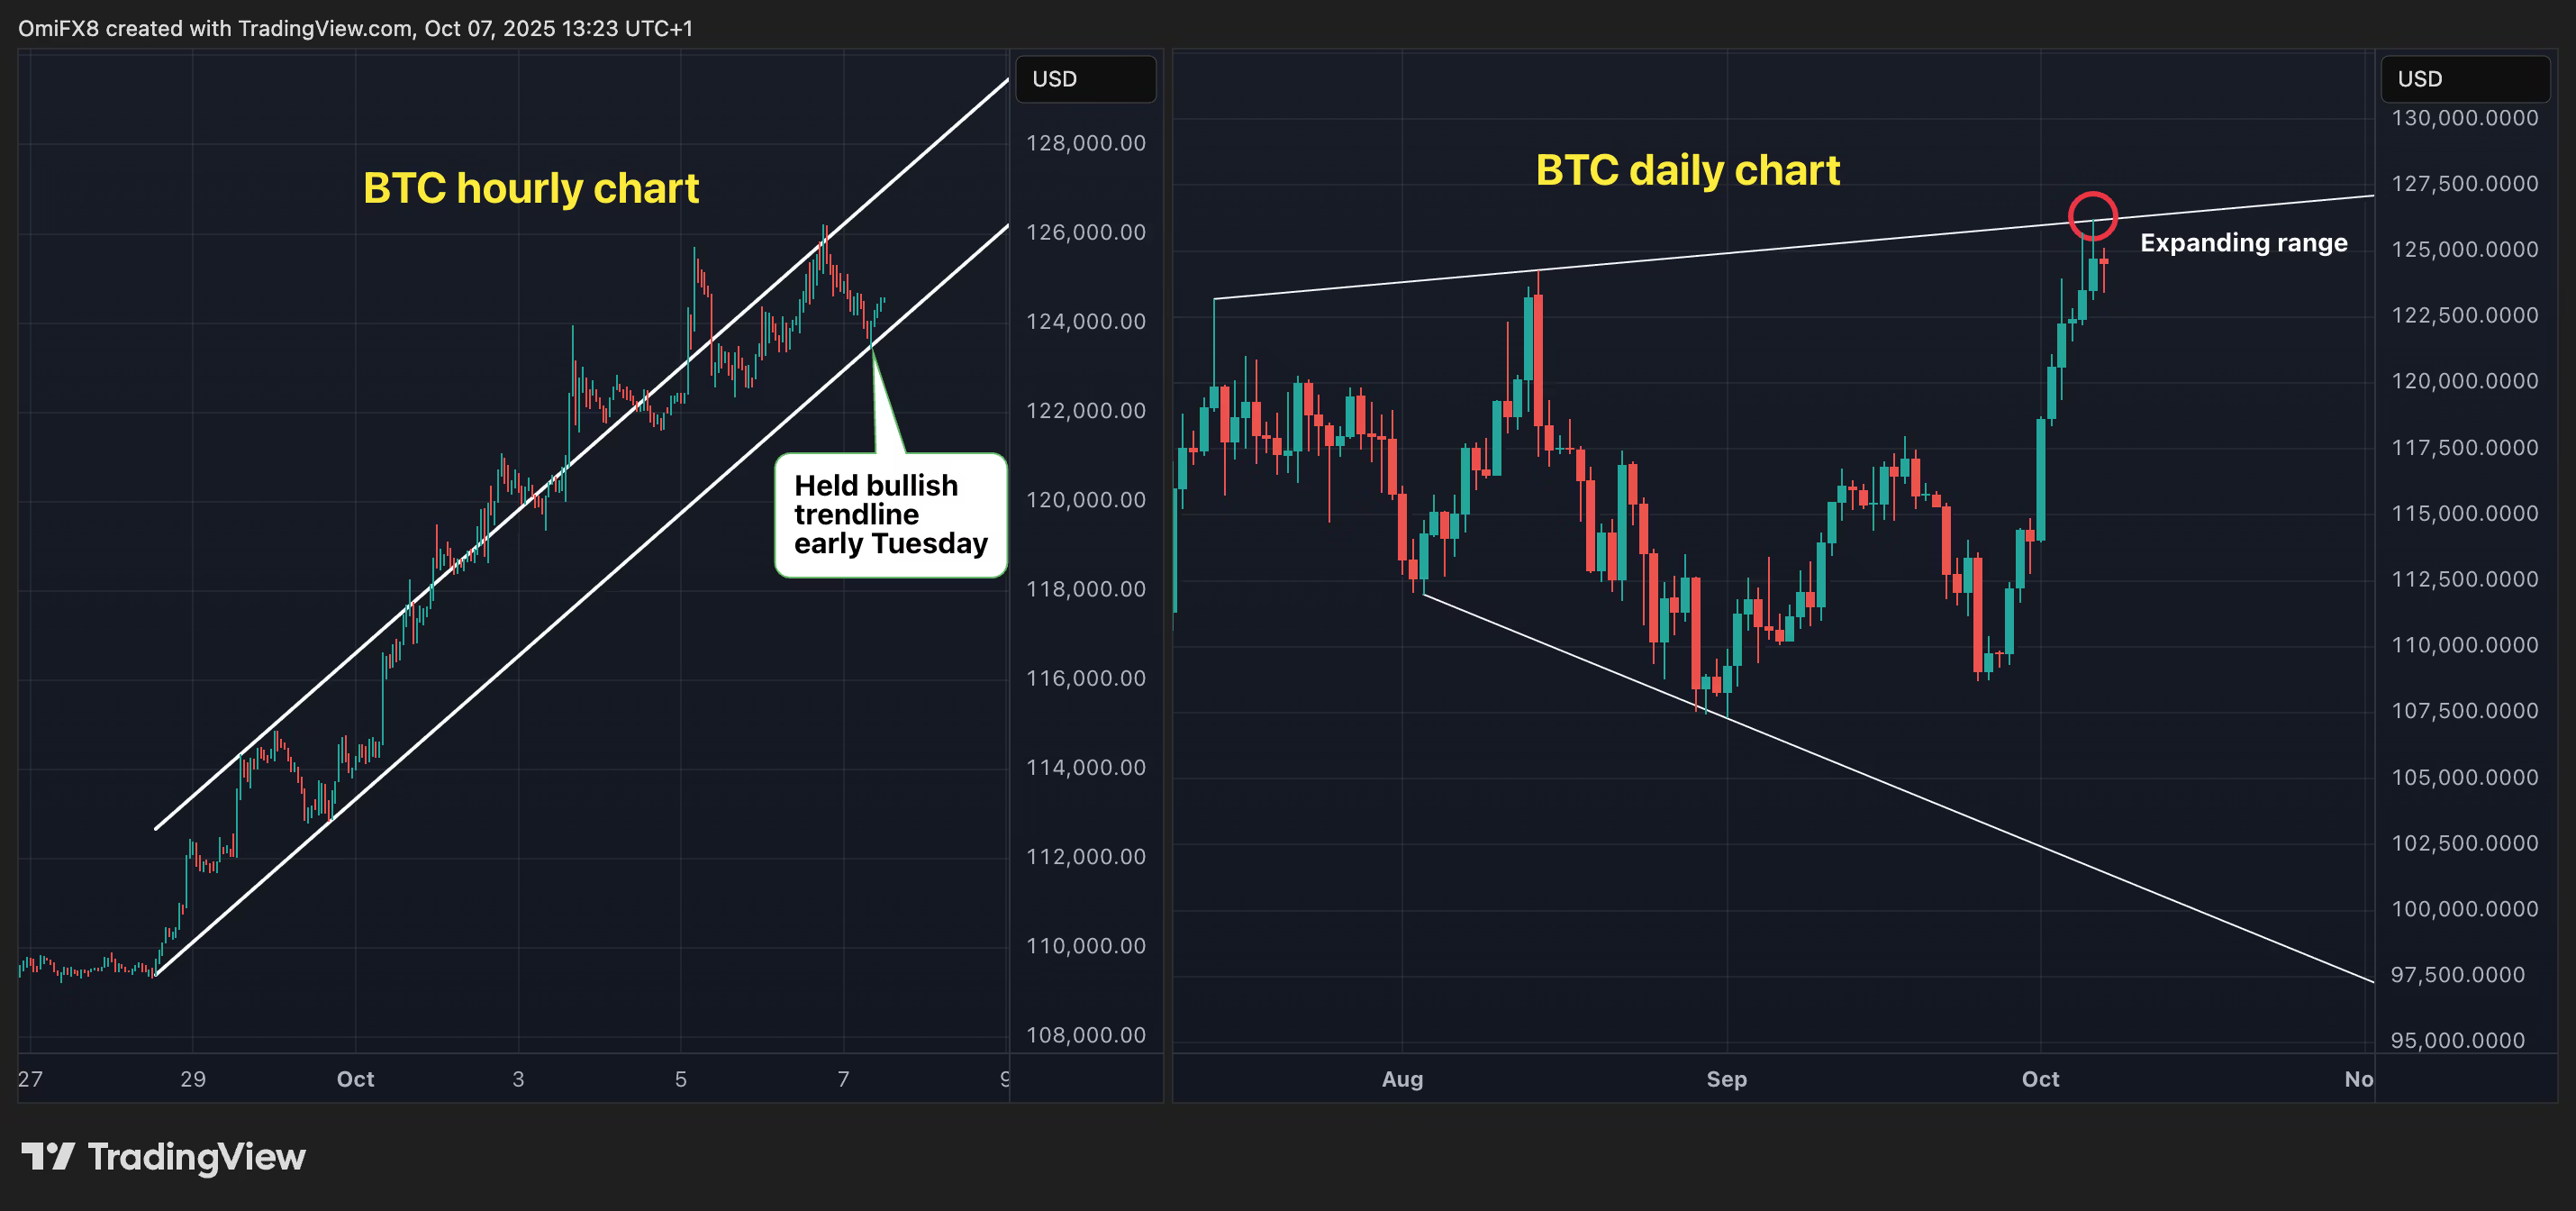
- Bitcoin's upward movement remains strong, despite a recent pause. The trendline from lows under $110,000 is intact.
- A potential breakout above the expanding triangle on the daily chart could push BTC towards the $135,000-$140,000 range.
- If BTC drops below the ascending trendline on the hourly chart, a correction may occur with support around $118,000.

Traditional Market Indicators
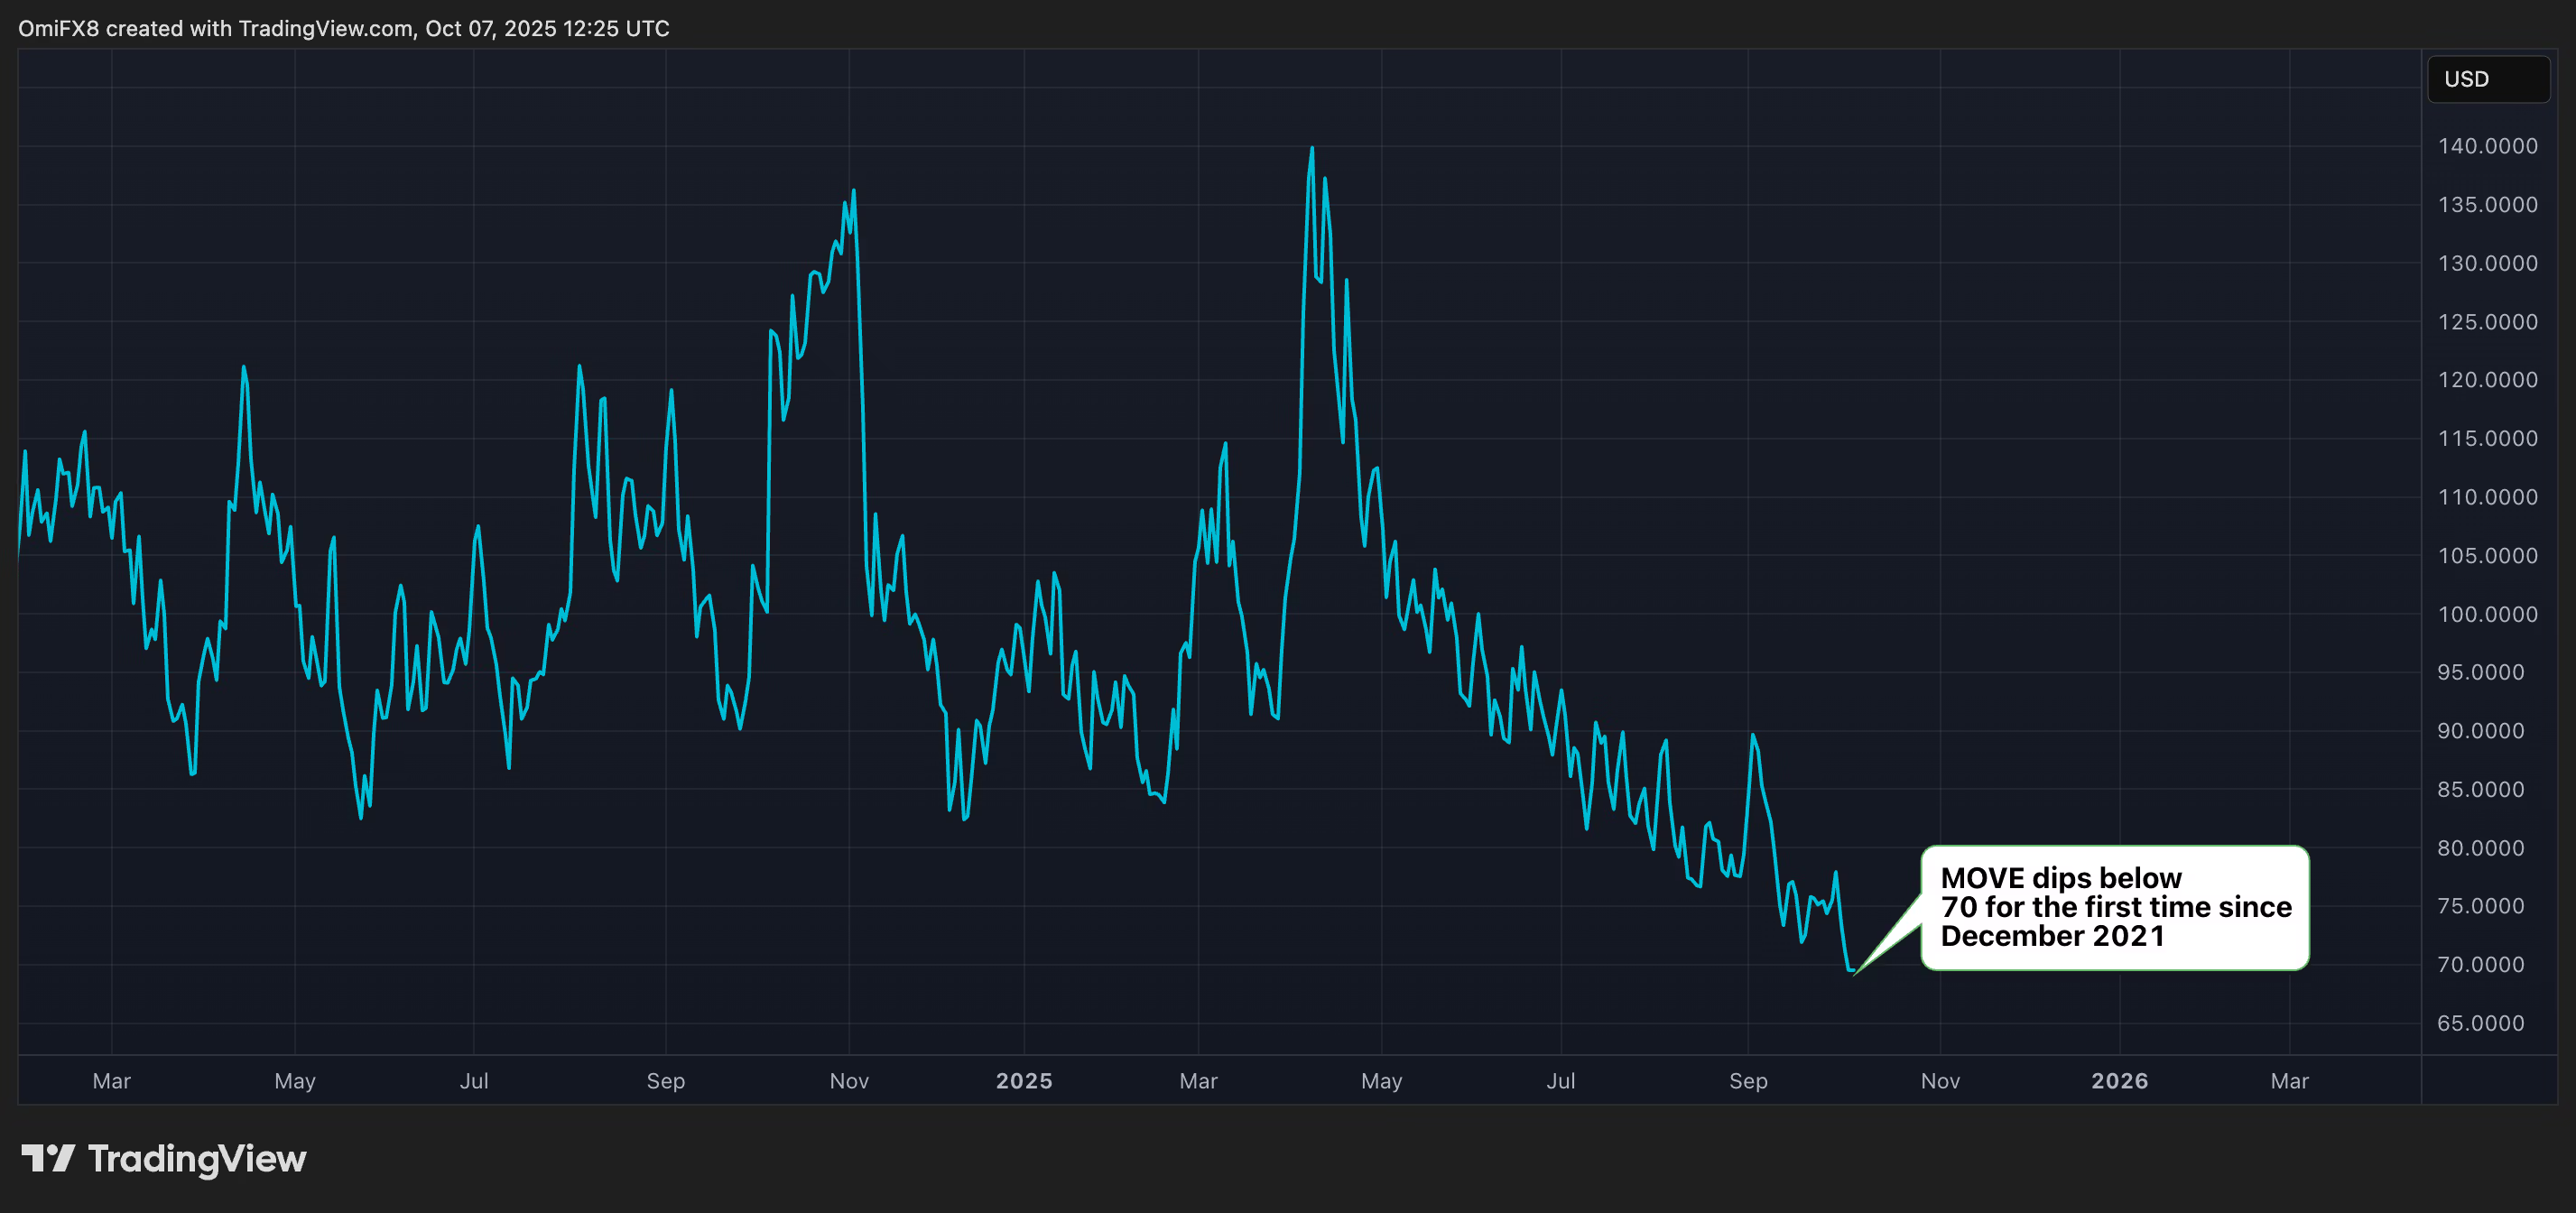
- The MOVE index indicates lower expected volatility, suggesting easier conditions for risk assets.
- The dollar index (DXY) and 10-year Treasury yields remain strong, potentially affecting crypto market dynamics.
- Goldman Sachs warns of potential spillover effects from Japan's bond market into U.S. Treasuries.

Ethereum (ETH) Outlook
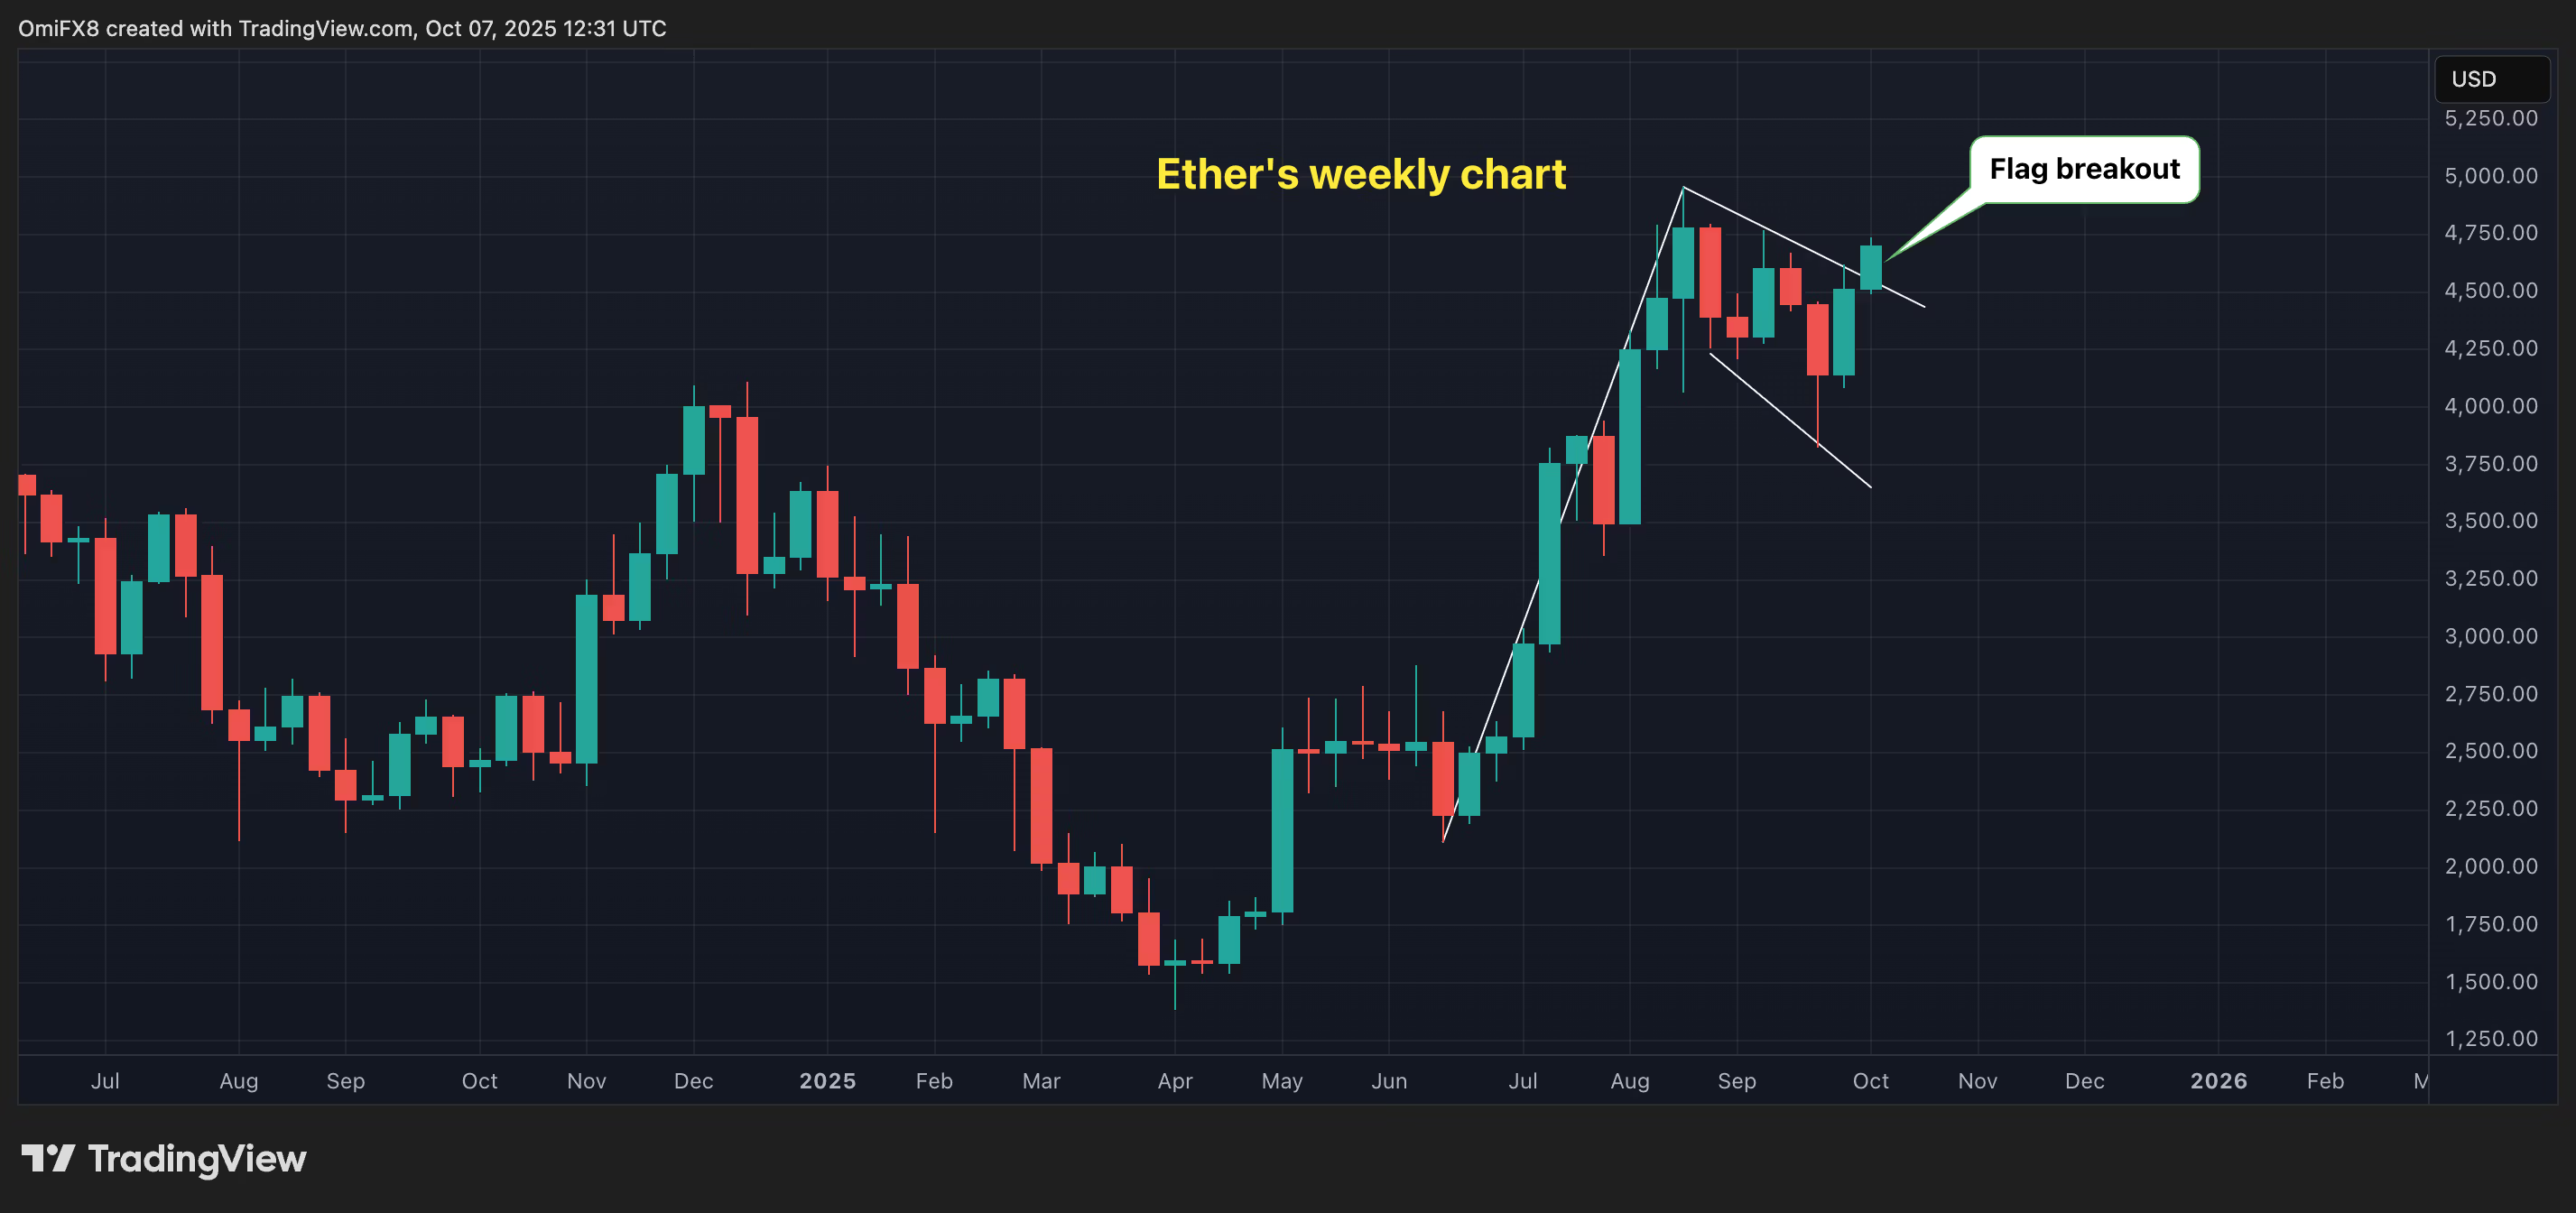
- Ether (ETH) has gained 4%, forming a bull flag breakout on the weekly chart.
- A sustained rally above $5,000 is possible if the pattern holds.
- A sell-off by week's end could indicate bearish control.
