Dec 25, 2025
14 2
Bitcoin May Bottom in October 2026, Analyst Predicts Based on History
An analyst, Ali Martinez, has discussed the historical patterns of Bitcoin's price cycles, suggesting a consistent rhythm in timing and depth. Key insights include:
- Bitcoin historically takes approximately 1,064 days to reach a cycle top from the bottom of the previous bear market.
- The interval from a cycle top to the following bottom is around 364 days, indicating a potential bottom for Bitcoin in October 2026 if patterns hold.
- Previous bear markets saw drawdowns of 84.22% in 2018 and 77.57% in 2022; the current cycle could see a 70% drawdown, targeting $37,500.

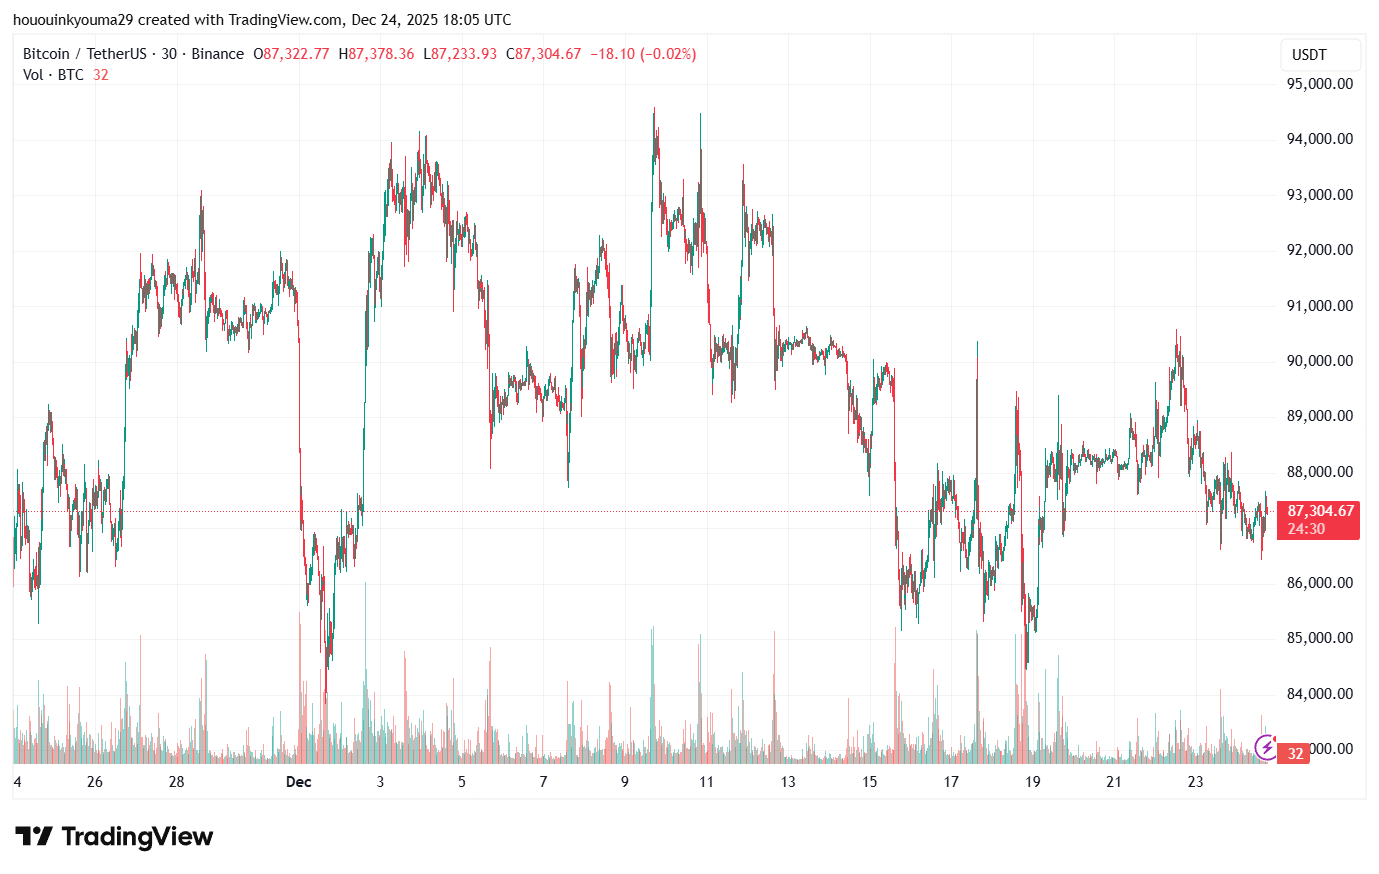
In the short term, Bitcoin's 4-hour chart exhibits a Parallel Channel pattern, indicating recent consolidation between trendlines acting as support and resistance.
- Bitcoin retested the lower line of this channel last week, rebounding to the middle zone, showing no clear directional bias currently.
As of now, Bitcoin is priced at approximately $87,300, with a 0.7% increase over the past week.