Feb 7, 2026
1 0
BEARISH 📉 : Bitcoin breaks key support as bearish momentum intensifies
Bitcoin Market Overview
- Bitcoin currently trades around $65,000 amid persistent selling pressure, increasing investor uncertainty.
- The cryptocurrency has dropped approximately 17% this year due to factors such as $12 billion in ETF outflows, global risk aversion, and regulatory ambiguity.
- Despite heavy institutional selling, historical patterns suggest potential for reversal as accumulation often follows distribution phases.
Market Cycle Analysis
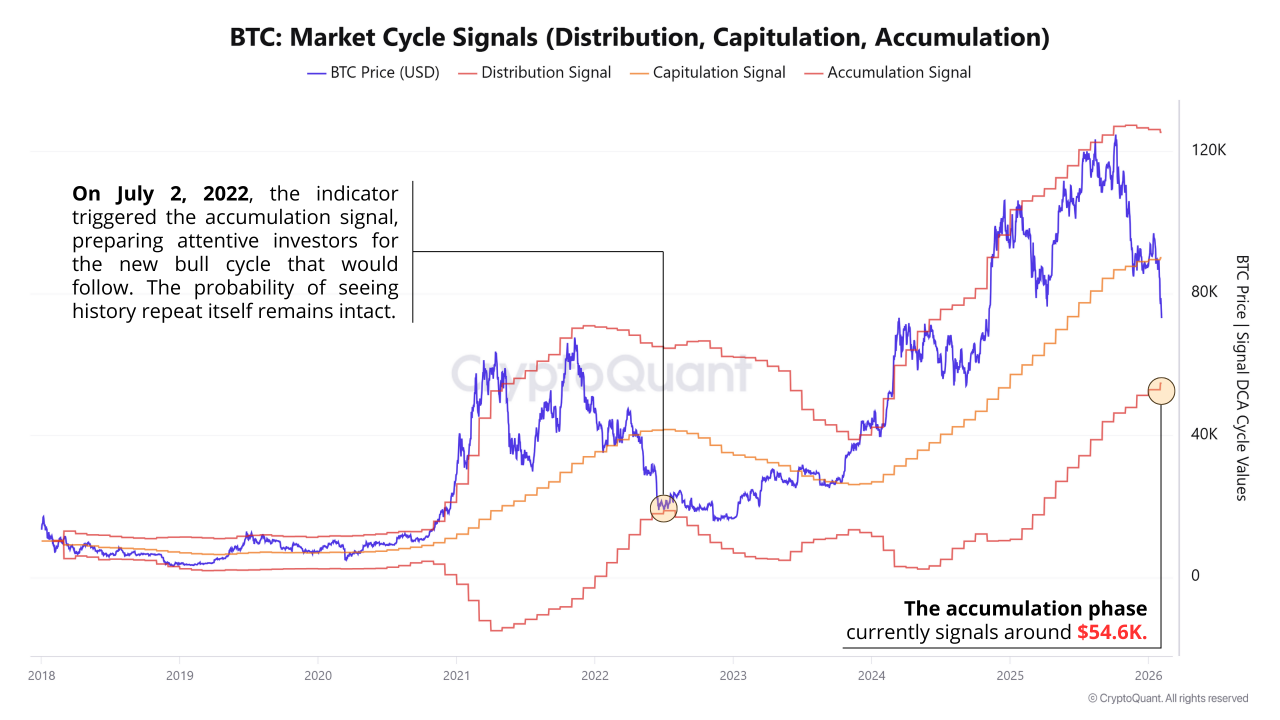
- The BTC Market Cycle Signals indicator uses Bollinger Band positioning to interpret Bitcoin’s cycle phases: Distribution, Capitulation, and Accumulation.
- Current indicators suggest a convergence toward an early accumulation phase around $54,600, a transitional zone between capitulation and renewed activity.
- However, market reversals require confirmation through liquidity inflows and sustained demand rather than technical signals alone.
Technical Analysis: Bearish Momentum
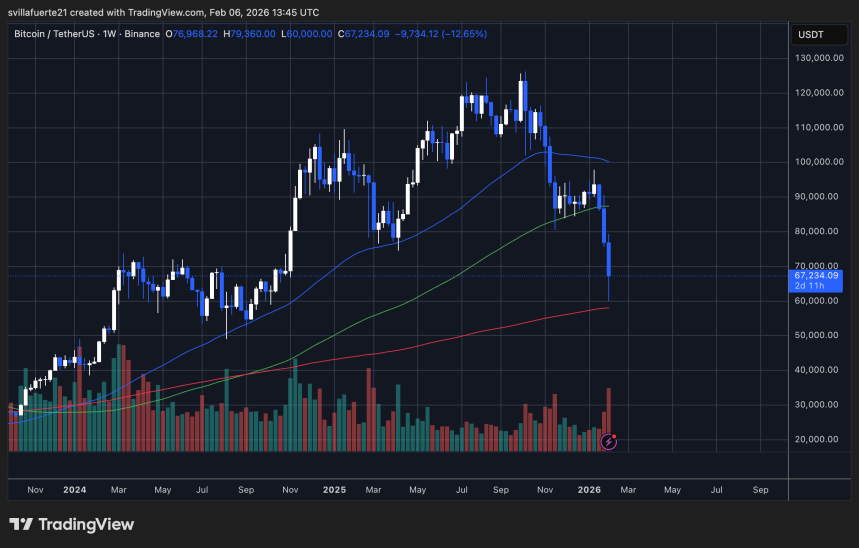
- Bitcoin broke below the $70,000 level, with recent prices closing near $67,200, indicating a bearish trend continuation.
- Currently trading below the 50-week and 100-week moving averages; the 200-week average lies near mid-$50K, a historical support region.
- The market may be transitioning from a late bull-cycle correction into a bear-market consolidation unless it stabilizes above the $70K–$75K range.