4 0
Bitcoin Chart Patterns Indicate Potential Bull Run Following $109K Rally
Recent technical analysis indicates potential bullish patterns for bitcoin (BTC) that resemble those preceding the late 2024 rally from $70,000 to $109,000.
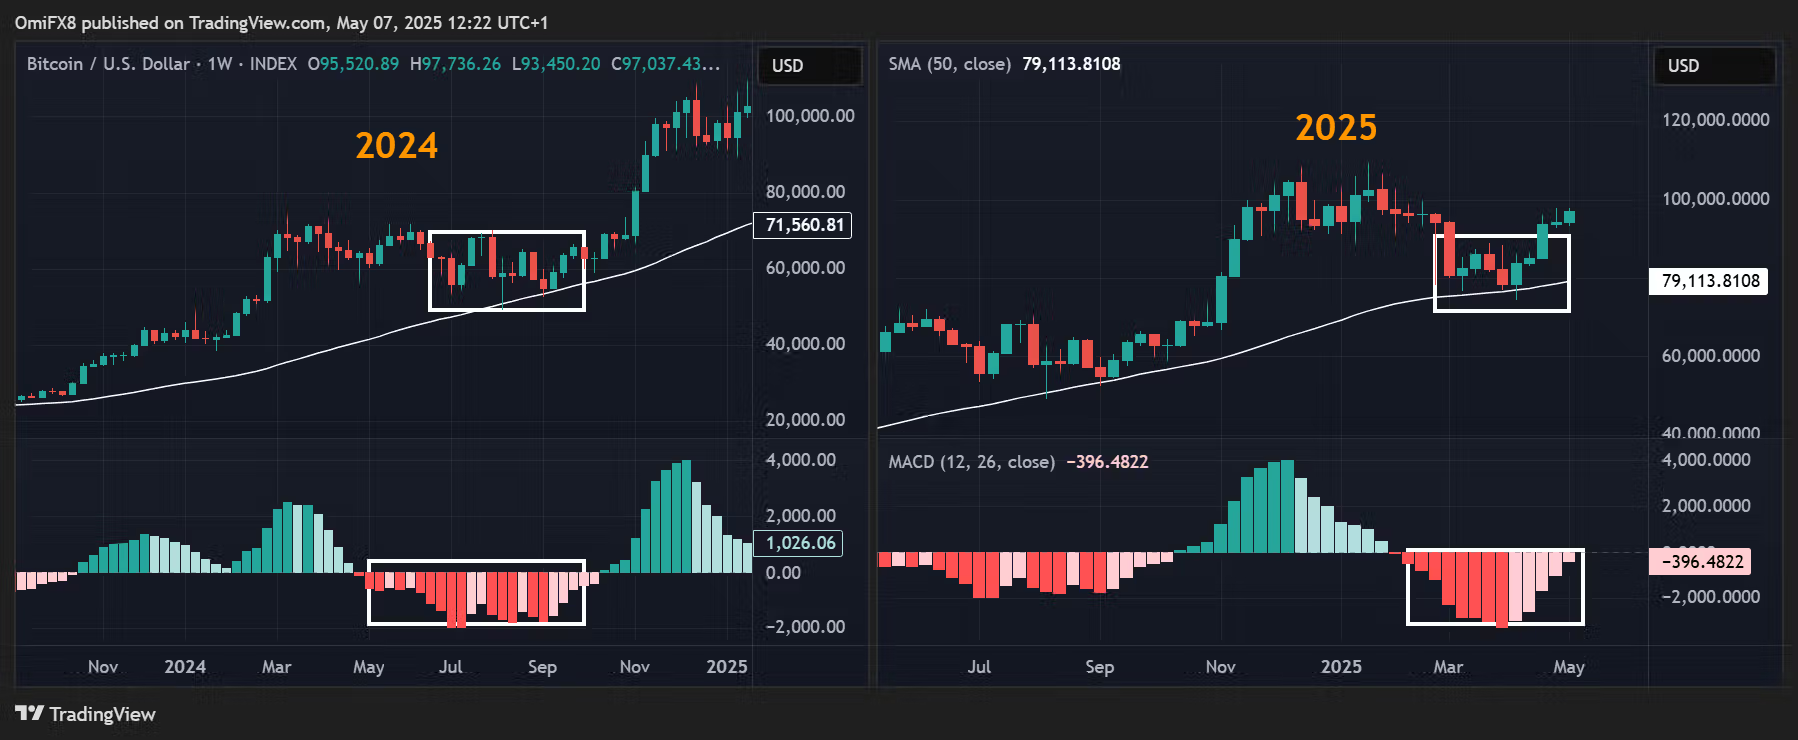
- The MACD histogram shows a bearish crossover but needs price validation; currently, BTC has bounced back above $90K after finding support at the 50-week SMA.
- This pattern mirrors last year's trend where prices held above the SMA amid bearish MACD signals before flipping bullish in mid-October.
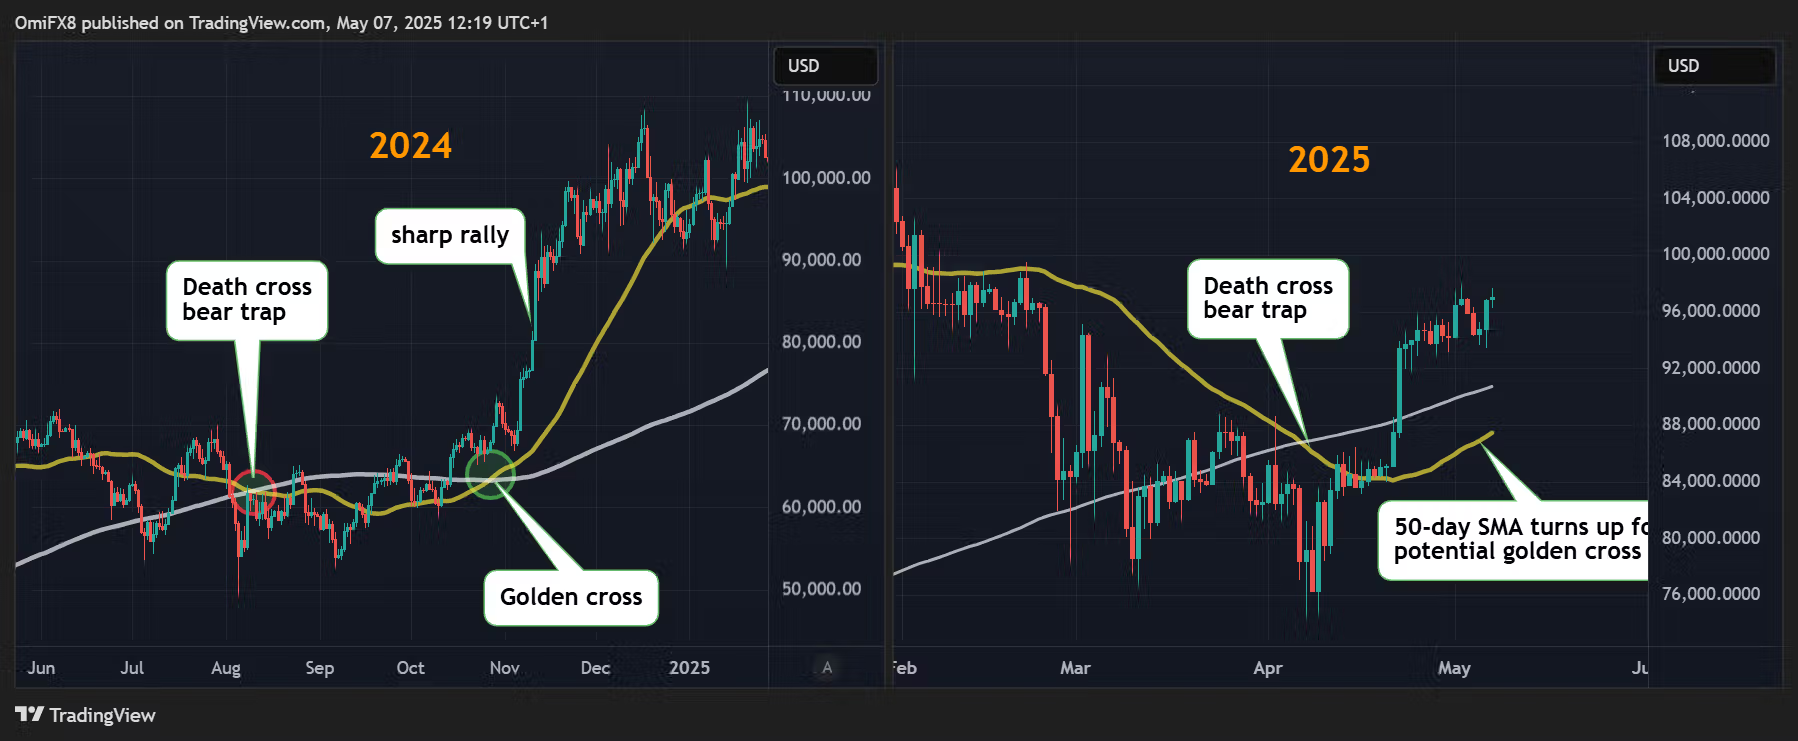
- A recent bearish crossover of the 50- and 200-day SMAs indicated a potential downtrend. However, BTC found support around $75K and is now showing signs of a recovery.
- The rising 50-day SMA may soon cross above the 200-day SMA, potentially forming a golden cross and signaling bullish momentum.
- Historical data suggests that such patterns can precede significant price increases, although macroeconomic factors can influence market directions.

