Bitcoin CME Chart Reveals Similar Patterns to 2023 Price Movements
A crypto analyst has identified similarities between Bitcoin's Chicago Mercantile Exchange (CME) chart from late Q4 2024 and 2023. The analysis indicates that the 2024 Bitcoin CME chart reflects patterns, wave structures, price movements, and key indicators akin to those seen in 2023.
Bitcoin CME Chart Mirrors 2023 Price Action
Comparative analysis of the Bitcoin CME charts from November/December 2023 and 2024 shows notable parallels. Crypto analyst Tony Severino shared these findings on X (formerly Twitter), highlighting an almost identical Elliott Wave count with five distinct waves indicating bullish patterns.
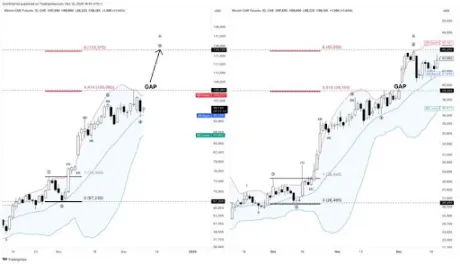
Both charts indicate a significant breakout from consolidation, with bullish momentum increasing as November and December approach. The Bollinger Bands for both years are expanding, suggesting potential upward trend continuation.
Bollinger Bands serve as technical analysis tools for identifying short-term price movements and entry/exit points. In both years, price action remains near the upper Bollinger Band, indicating a strong bullish trend.
Severino's analysis also notes similar Fibonacci extensions. In 2023, key extension levels at 4.416 and 6 were crucial, with BTC reaching $39,265 and $45,250. These levels appear on the 2024 chart, implying potential price targets of $105,465 and $124,125.
Another critical finding is the presence of gaps on the CME charts. A CME futures gap represents the difference between closing and opening prices. In 2023, a gap was filled during a price rally, with a comparable gap noted near $124,125 on the 2024 chart.
$120,000 BTC Price Target In Sight
Severino predicts a potential bullish move above $120,000 based on the similarities in Fibonacci extension levels between the two CME charts.
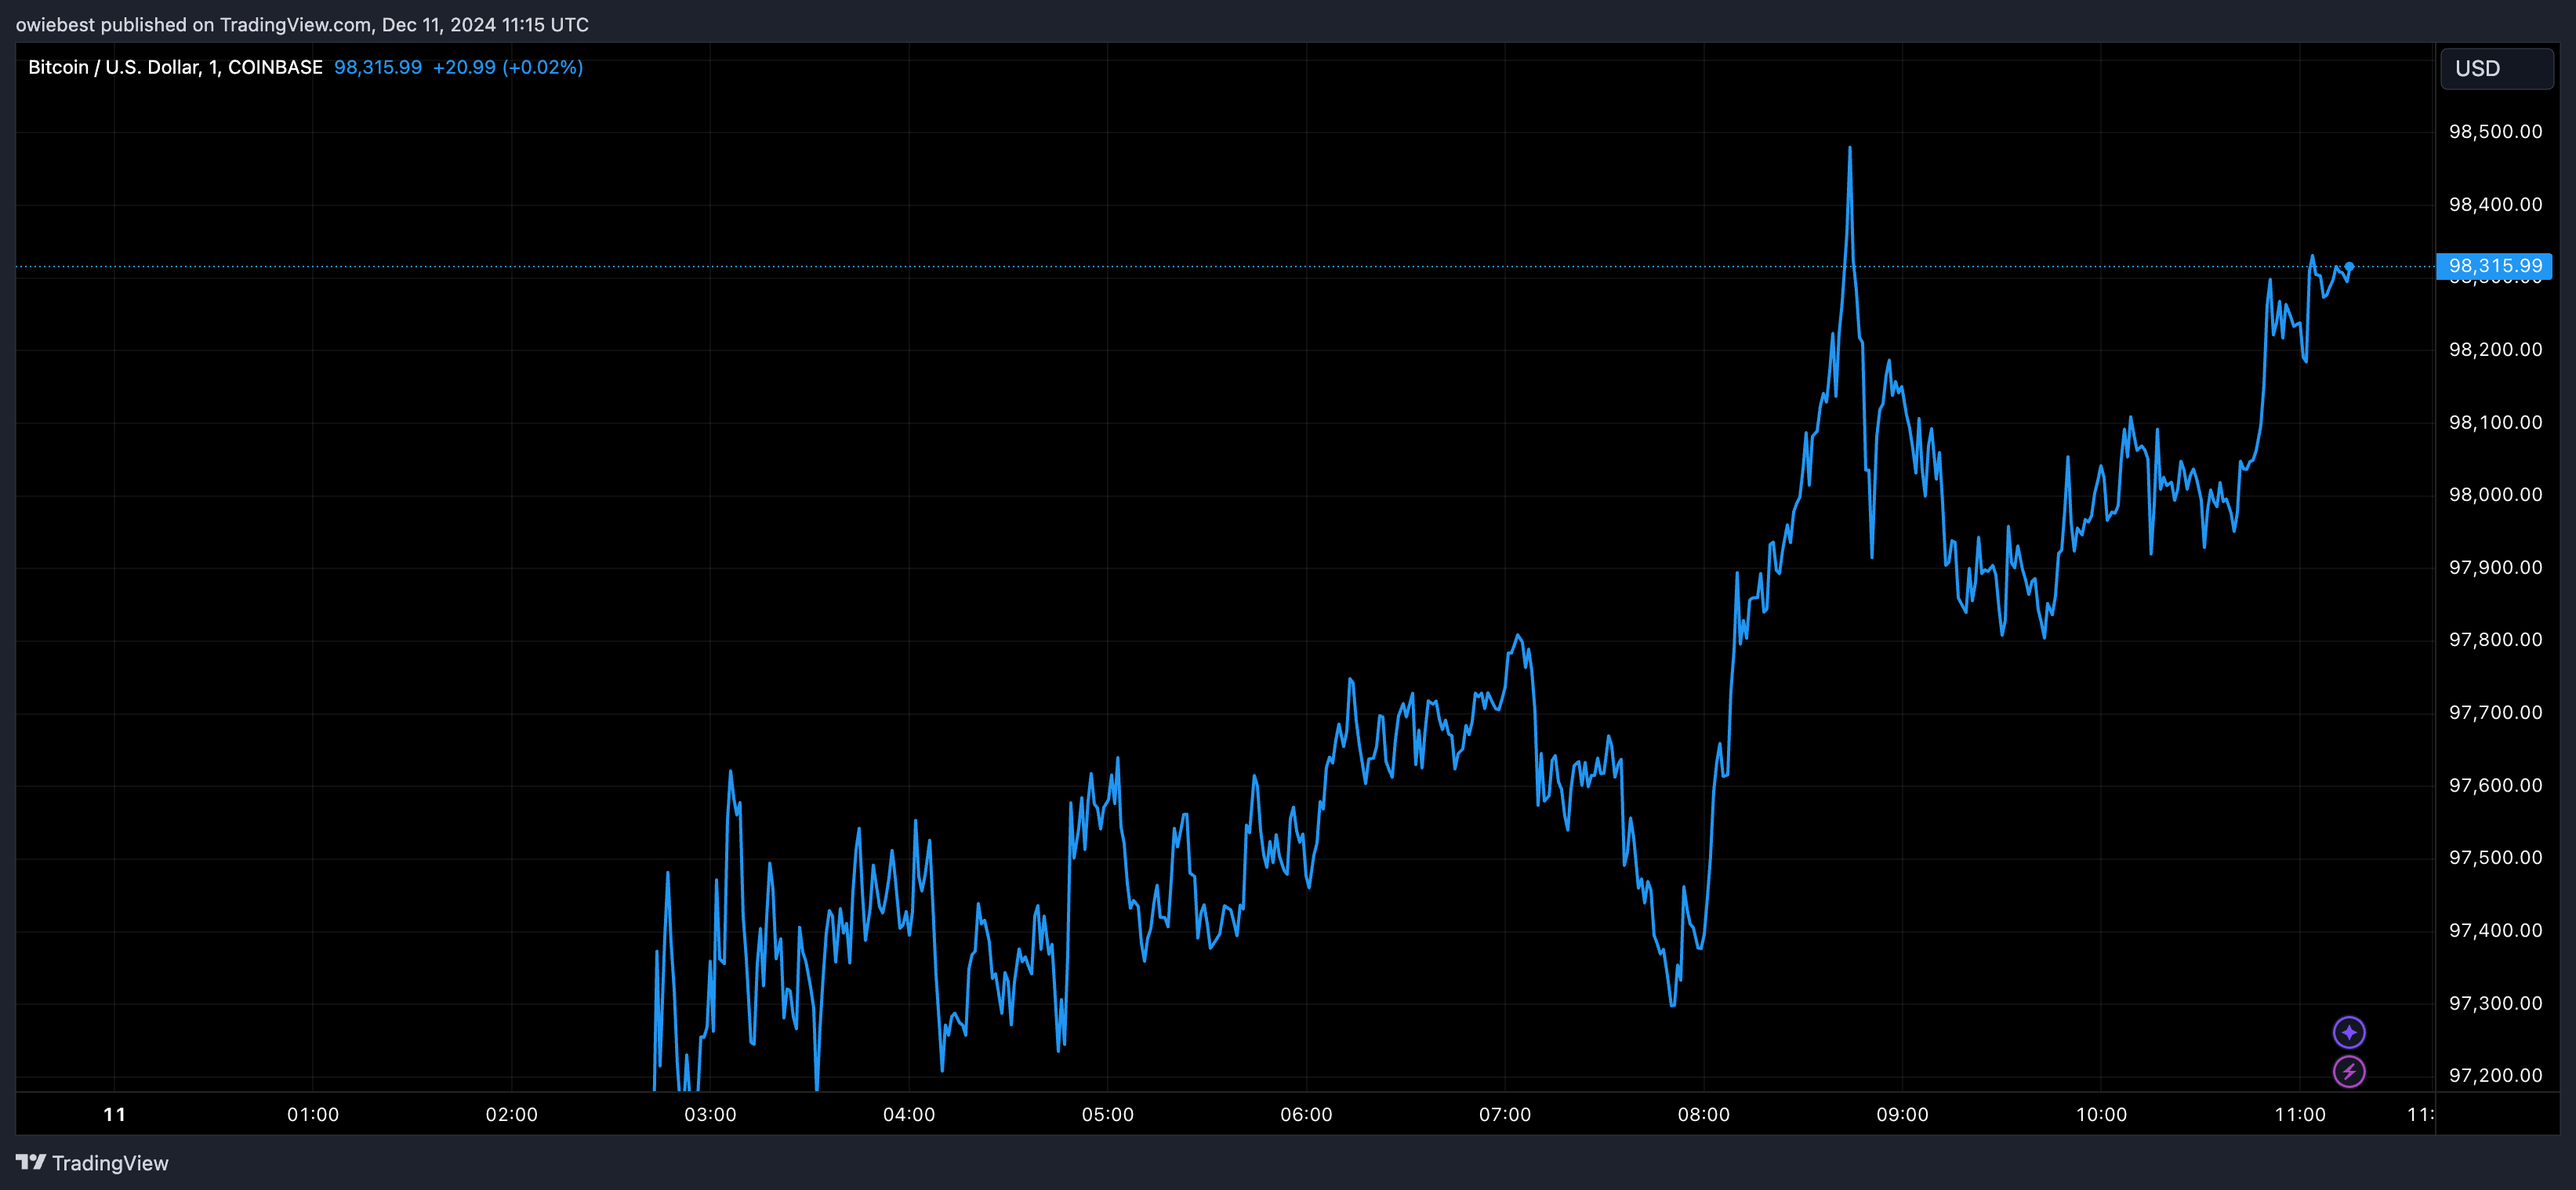
Recently, Bitcoin's price surged above $104,000, marking a new all-time high before correcting to $94,000, a decline characterized as a “flash crash.” Currently, Bitcoin trades at $97,638, showing a steady increase from previous lows. If this bullish trend persists, Bitcoin may approach its $100,000 ATH.