Bitcoin Composite Index Reaches 0.8 Indicating Potential Bull Market
Bitcoin experienced a slight decline following a peak above $97,000 on May 2, retreating to just below $94,000, marking a 3% to 4% drop. Despite short-term volatility, longer-term on-chain data shows potential indicators for future price movements.
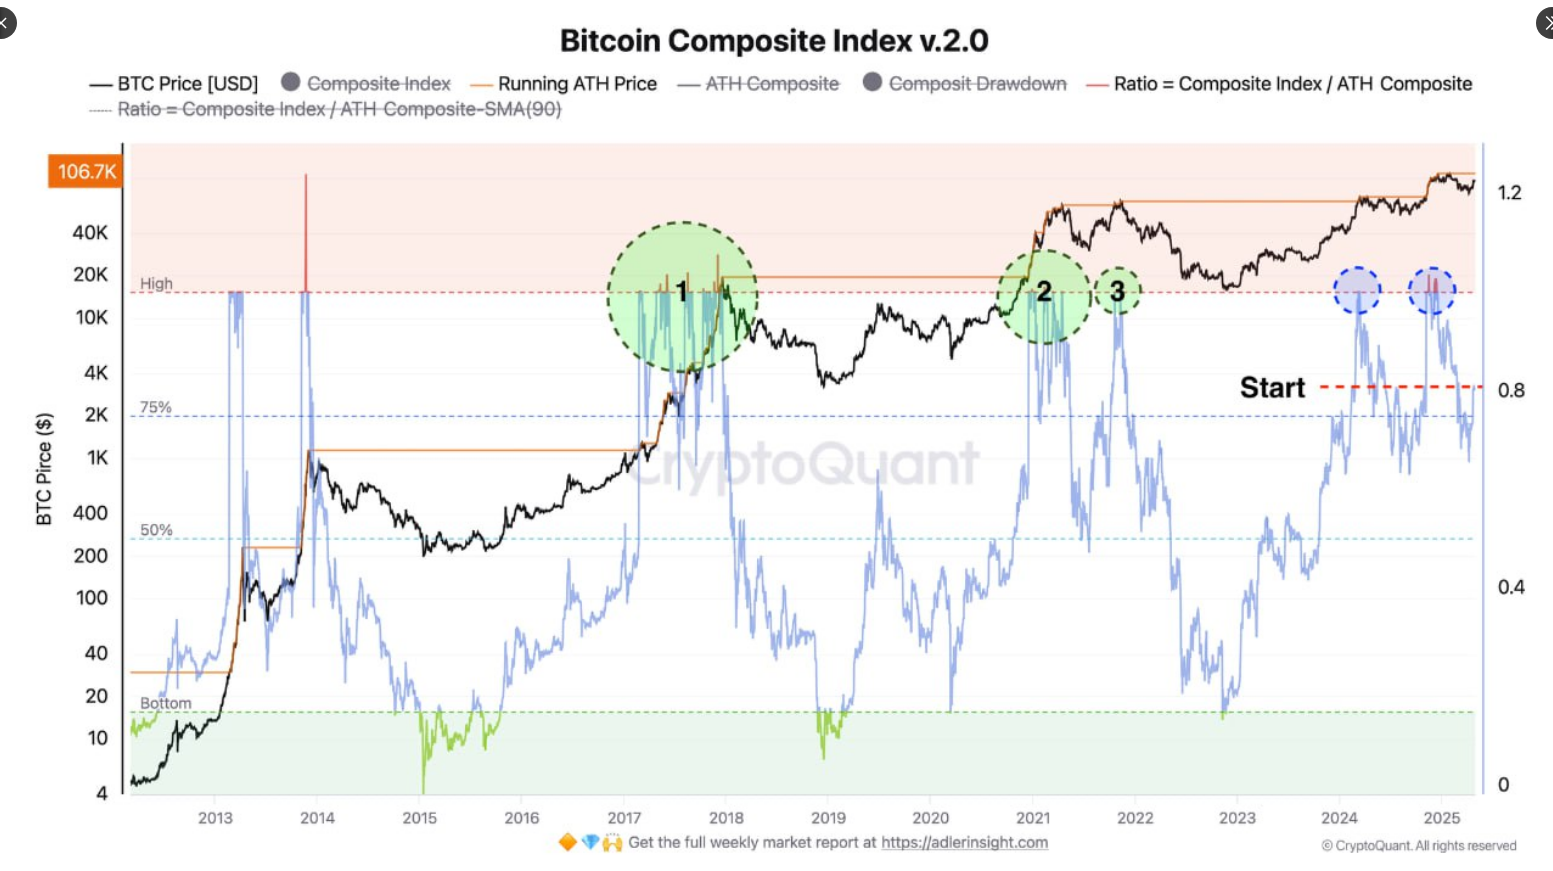
Index Reading Indicates A Potential Early Bull Market
The Bitcoin Composite Index v2.0 currently stands at 0.8, indicating market activity that historically precedes significant price rallies. Analyst Constantin Kogan noted that if the index reaches and maintains a reading of 1.0, Bitcoin could see accelerated growth. The upward trend in the "Running ATH Price" suggests increasing buyer confidence.
The upward momentum in Bitcoin is just starting to build...
Price Target May Hit $175K If Momentum Continues
If the Composite Index surpasses 1.0, analysts project Bitcoin prices between $150,000 and $175,000. Alternatively, if the index remains between 0.8 and 1.0, Bitcoin may trade within a range of $90,000 to $110,000. A drop below 0.75 could lead to a correction to $70,000 to $85,000.
Supply Data Shows Where Buyers Stepped In
The UTXO Realized Price Distribution chart indicates significant buying activity between $93,000 and $98,000, forming a crucial supply zone. Investors in this range may influence future price behavior based on their holding or selling decisions.
Market Awaits Clear Move From Current Zone
Currently at approximately $94,000, Bitcoin's next price movement will depend on whether it breaks out from this zone. A strong breakout could drive prices higher, while failure to rise may attract selling pressure. Traders are closely watching the Composite Index and supply metrics to gauge the market's direction.