Bitcoin Could Crash 50%, Pushing MSTR ‘Underwater,’ Veteran Trader Warns
Veteran chartist Peter Brandt compared Bitcoin's current chart to a historical pattern from 1977 soybeans, suggesting a potential 50% decline for Bitcoin. This comparison sparked debate among experts.
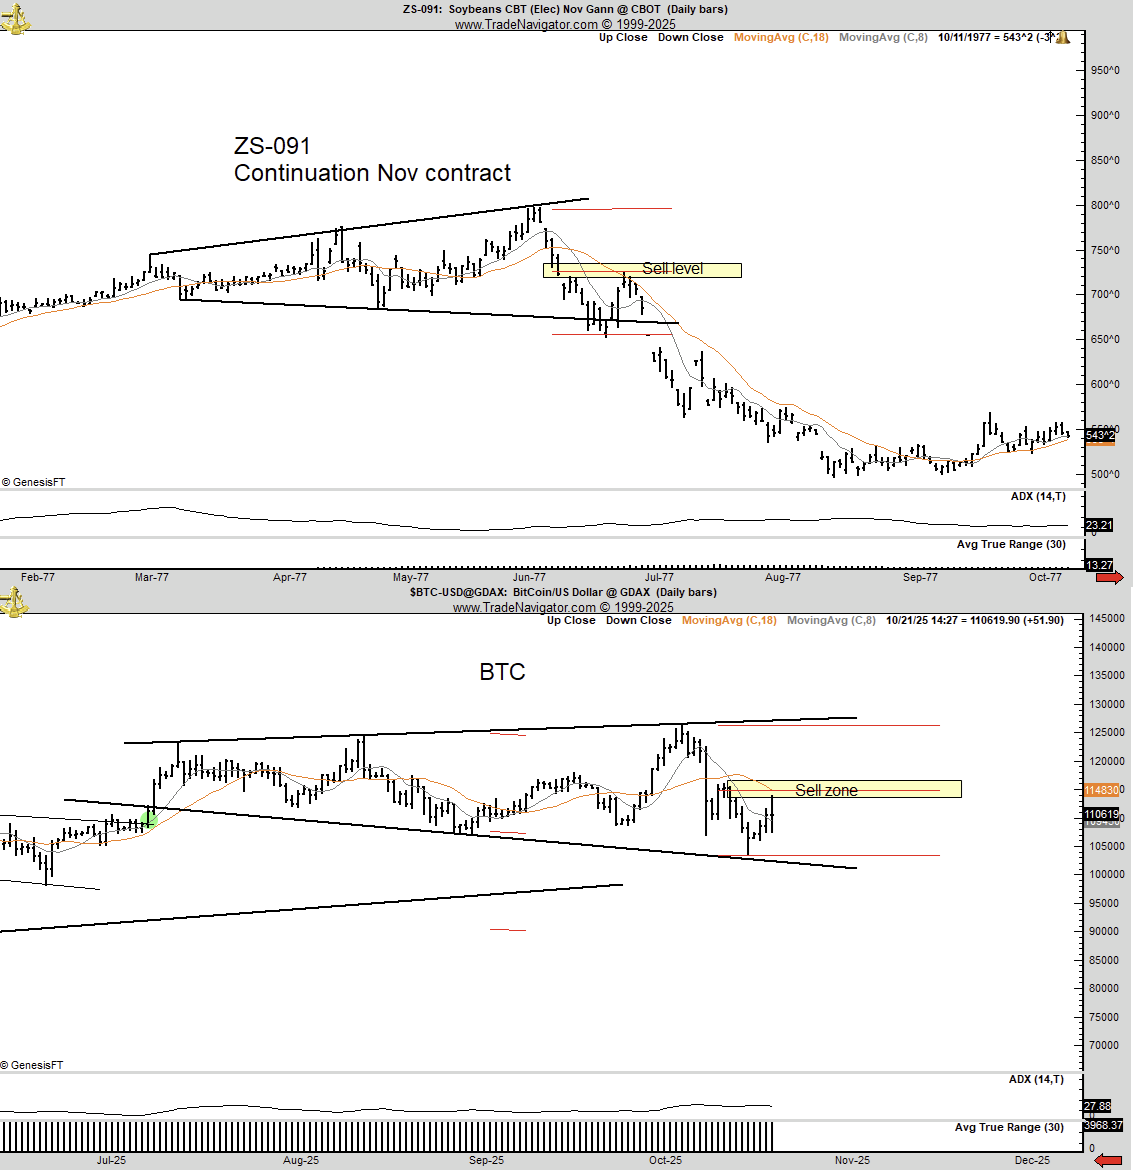
- Brandt identified an "Ascending Megaphone" in the soybean chart, which led to a sharp decline.
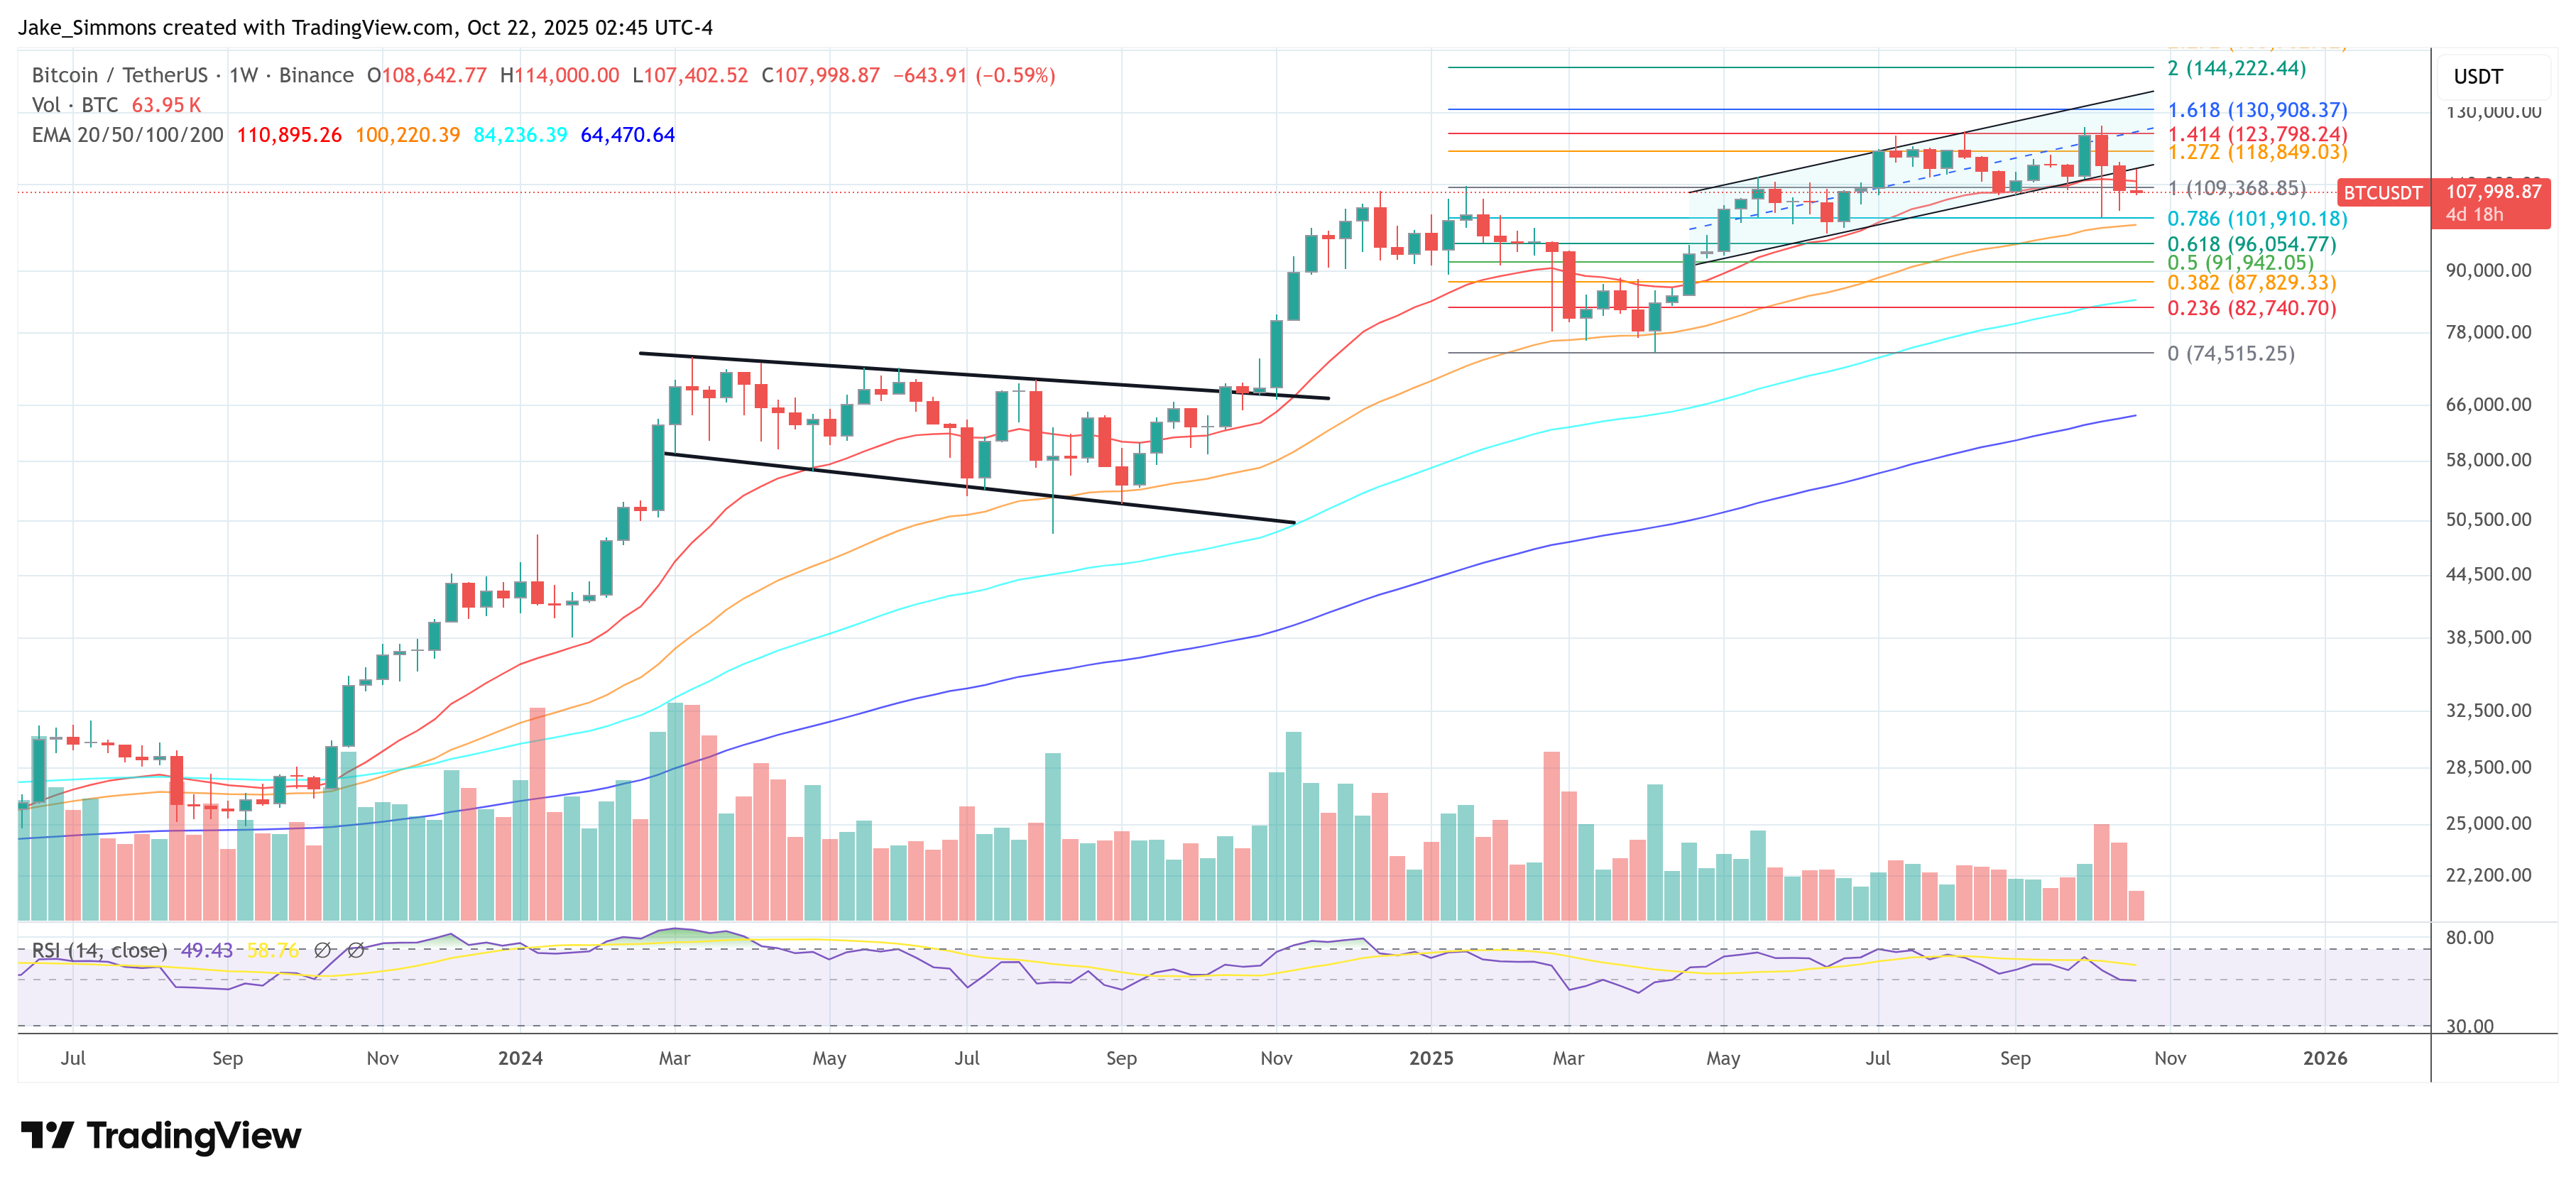
- The current Bitcoin chart shows an expanding range with upper trendlines slightly above $125,000 and lower trendlines around $100,000-$102,000.
- A "sell zone" is highlighted near the mid-range at approximately $114,800.
- Short-term moving averages and ADX readings indicate volatility within this range.
Francis Hunt countered Brandt's analysis, noting that while structures appear similar, their directional implications differ. He argued that Bitcoin's descending structure within a bull trend could eventually be bullish.
Brandt emphasized his approach as hypothetical, considering various outcomes like Bitcoin reaching either $250k or $60k. He acknowledged alternative interpretations and expressed readiness to adjust positions based on market direction.
Brandt highlighted second-order risks for MicroStrategy (MSTR), whose average Bitcoin acquisition price is $74,010. A significant BTC drop could impact the firm, given its large holdings of 640,418 BTC valued at $47.4 billion.
Current BTC price: $107,998.