Nov 7, 2025
5 0
Bitcoin Falls Below $103,500 Resistance, Faces Continued Downward Pressure
Bitcoin Price Analysis
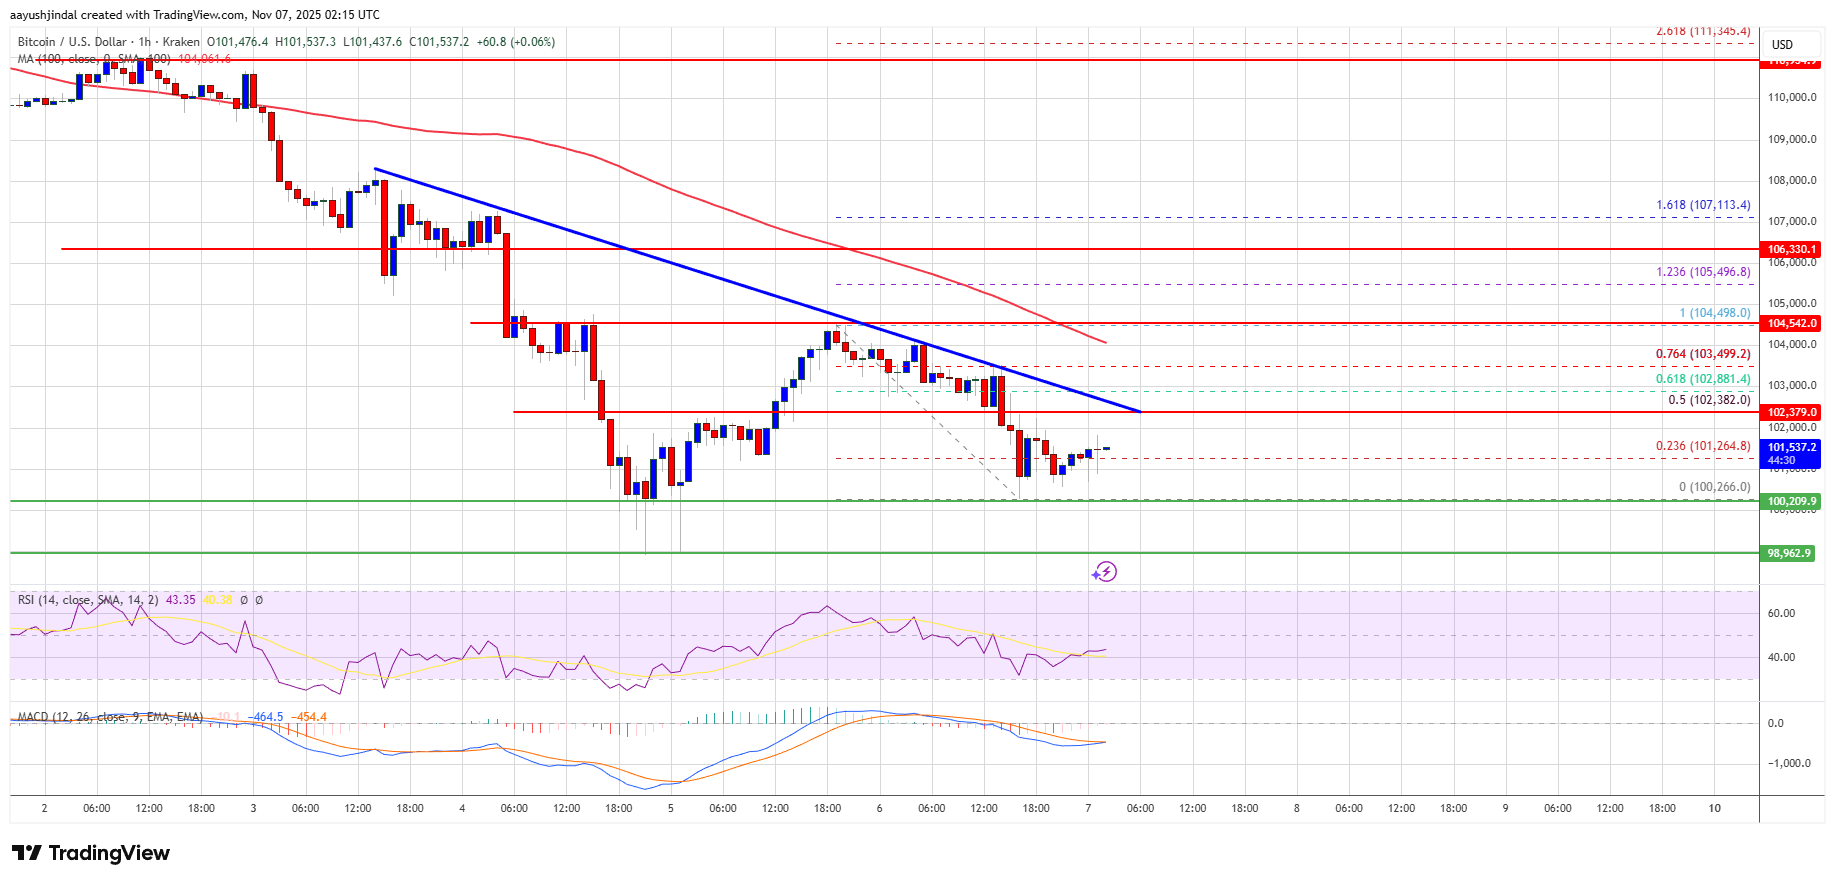
- Bitcoin is experiencing a downward trend, failing to maintain the $104,000 support and dropping below $103,500.
- The price is currently trading under $103,000 and below the 100-hourly Simple Moving Average.
- A bearish trend line forms with resistance at $102,400 on the BTC/USD hourly chart.
- If Bitcoin cannot surpass the $103,500 resistance zone, further declines are possible.
Current Resistance and Support Levels
- Resistance: Immediate resistance is around $102,400, followed by $103,500. If surpassed, potential targets include $104,200 and possibly $105,500 or higher.
- Support: Immediate support is near $100,500, with major support at $100,000. Further declines could push BTC toward $98,800 or even $96,500.
Technical Indicators
- MACD: Currently gaining momentum in the bearish zone.
- RSI: The RSI for BTC/USD is below the 50 level, indicating weak momentum.
Investors should monitor these levels closely as they may signal further price movements.